Question
Answer

Difficulty Level:
Medium
Solve in:
1 min
Use Calculator:
No


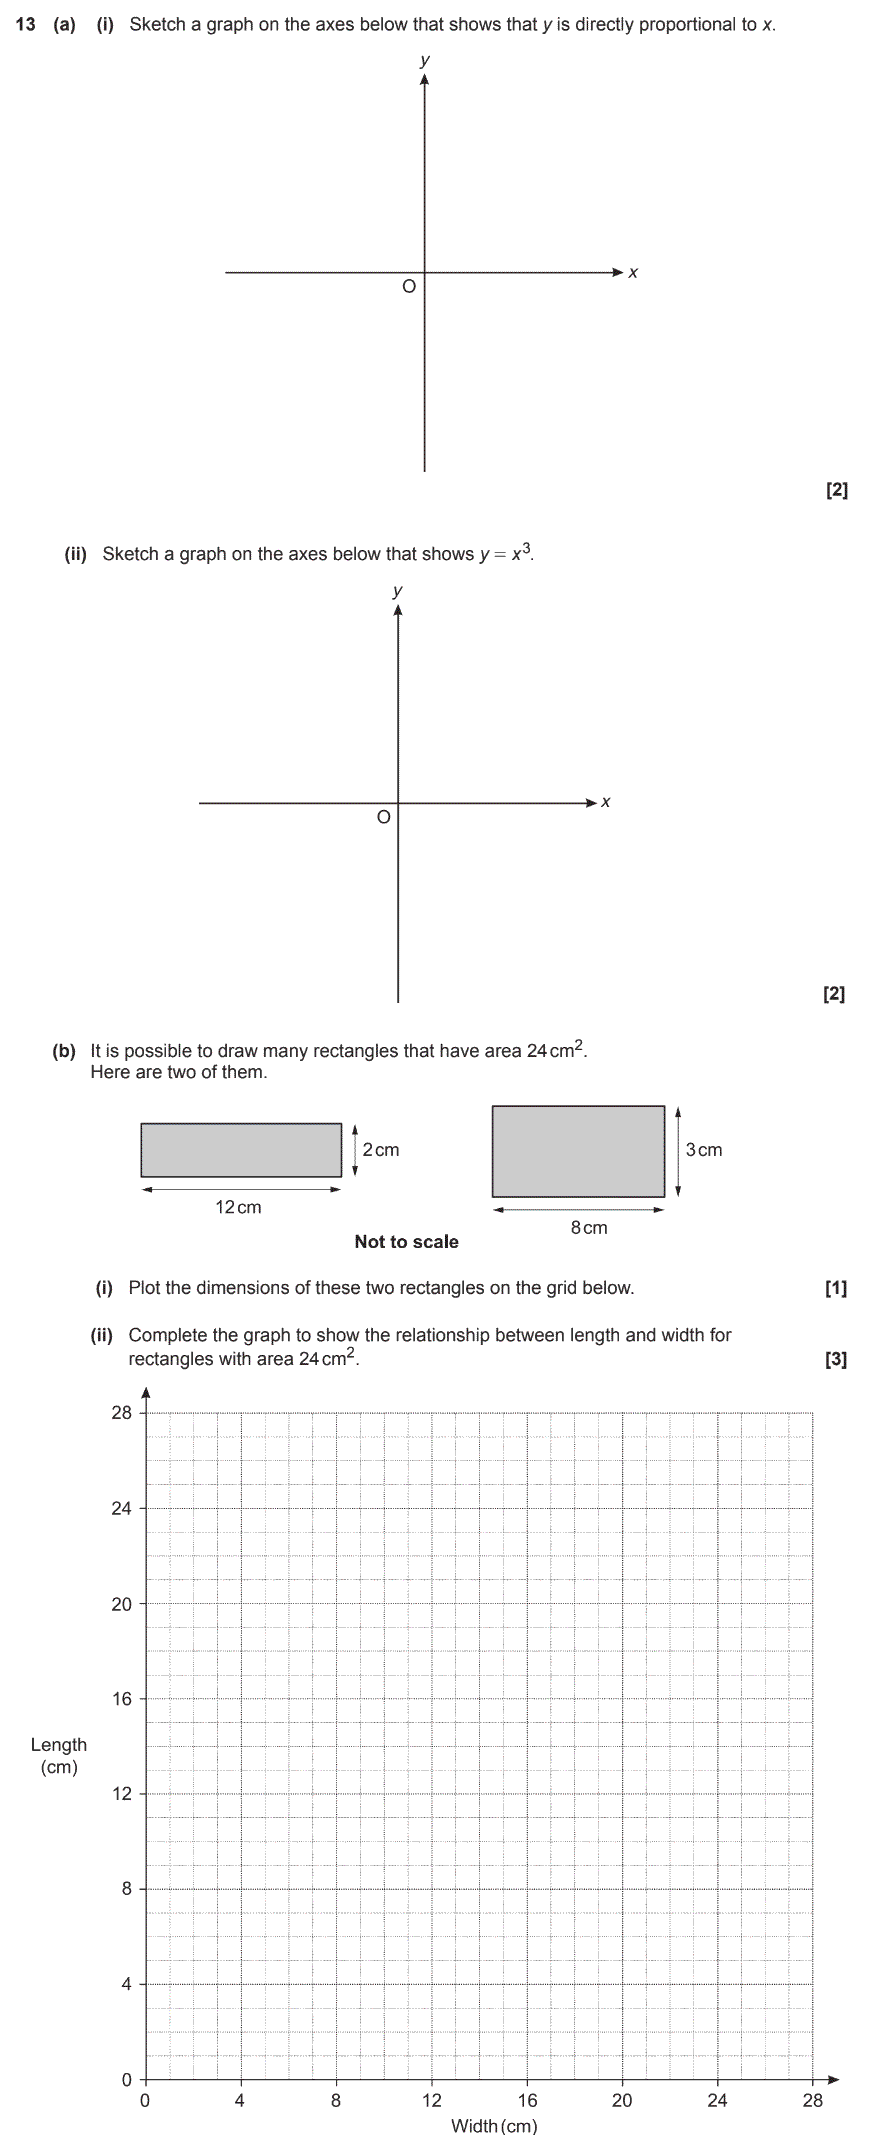


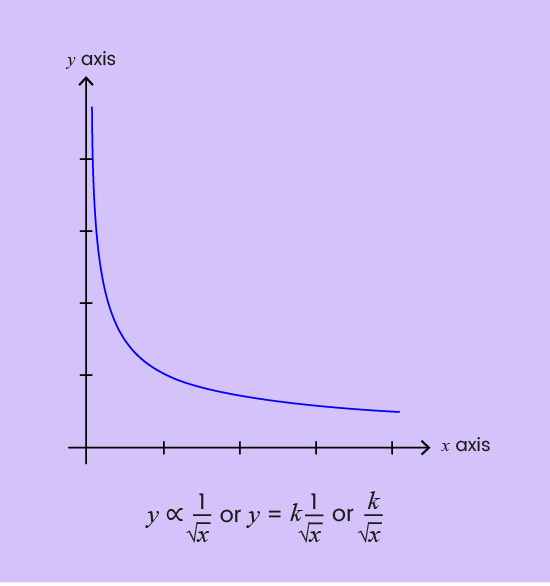
Proportions and graphs are ways to represent the relationship between two quantities. Once you know the kind of proportional relationship between two variables with each other, you can judge what kind of graphs you will get just by looking at the relation or vice-versa.
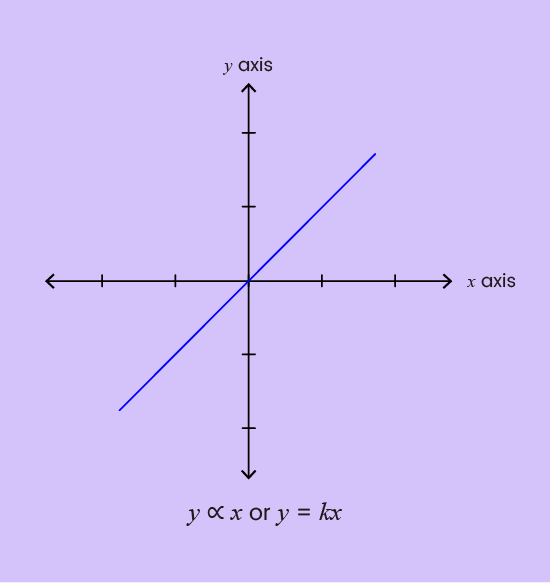
When two variables are in direct proportion with each other, an increment in one variable leads to an increment in another in the same proportion, the same must be visible in their graphs as well.
When two variables are inversely proportional to each other, an increment in one variable leads to a decrement in another in the same proportion, the same must be visible in their graphs as well.
Examples:
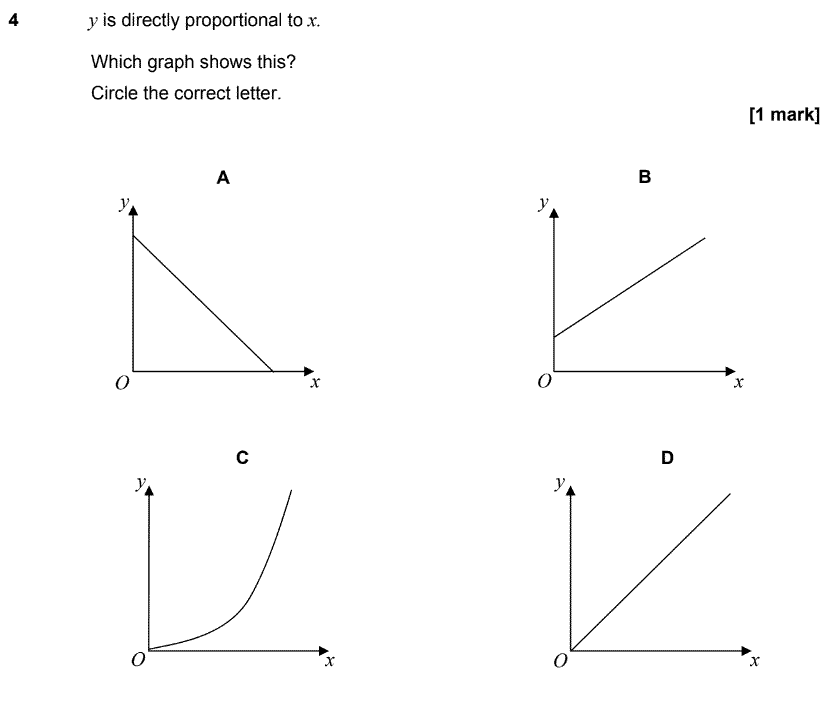
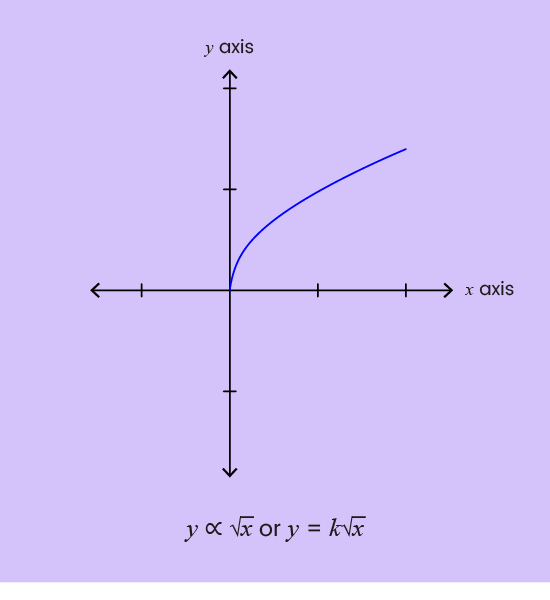
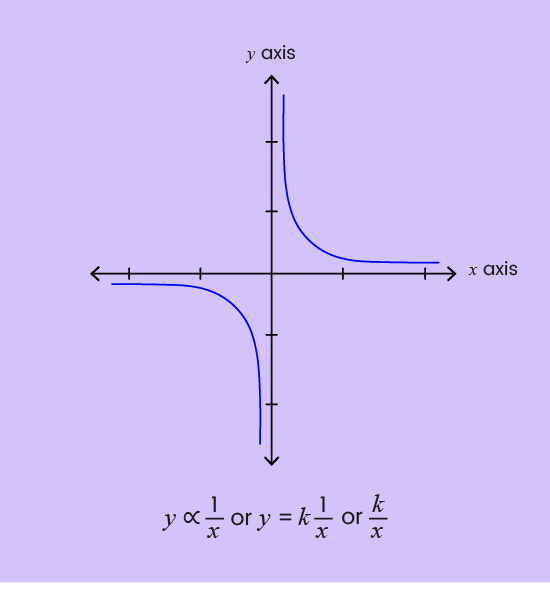
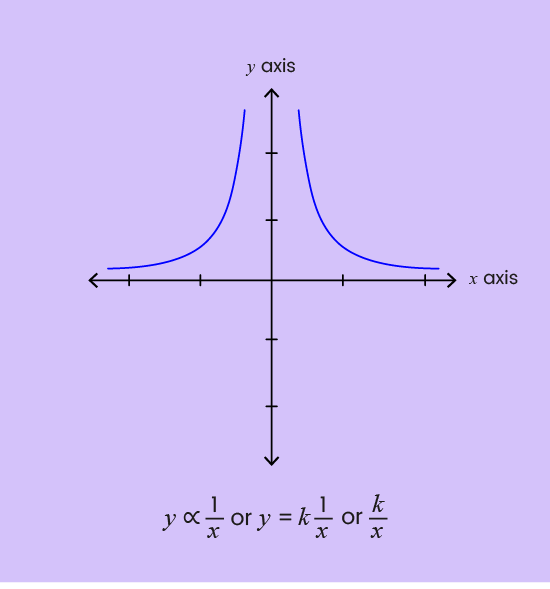
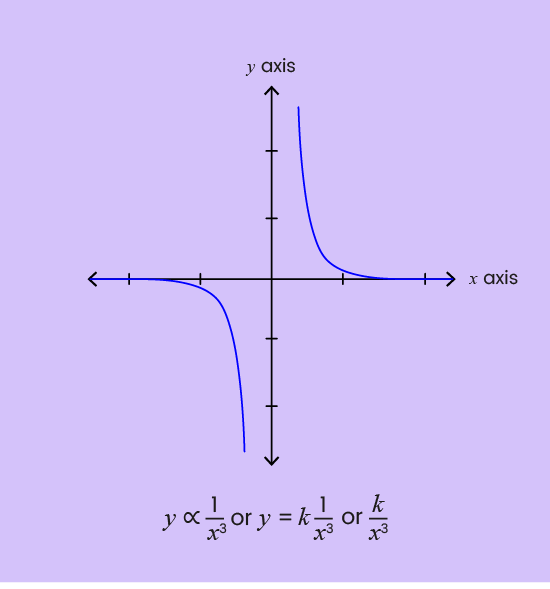
These graphs show different relationships between the variables x and y.
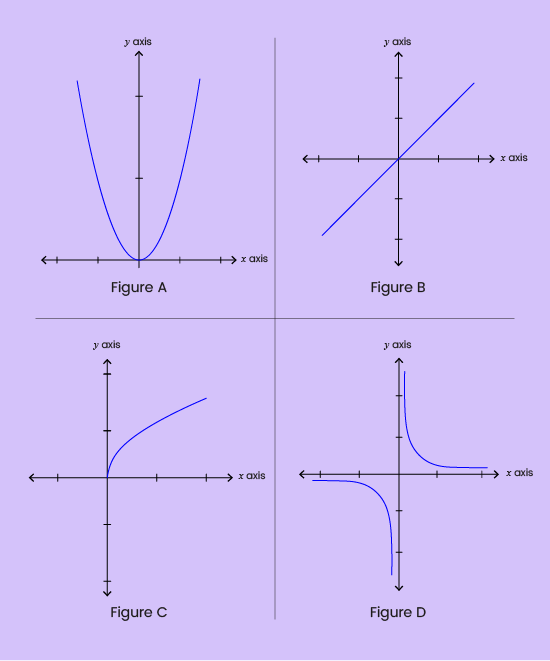
Identify the graph which shows the following.
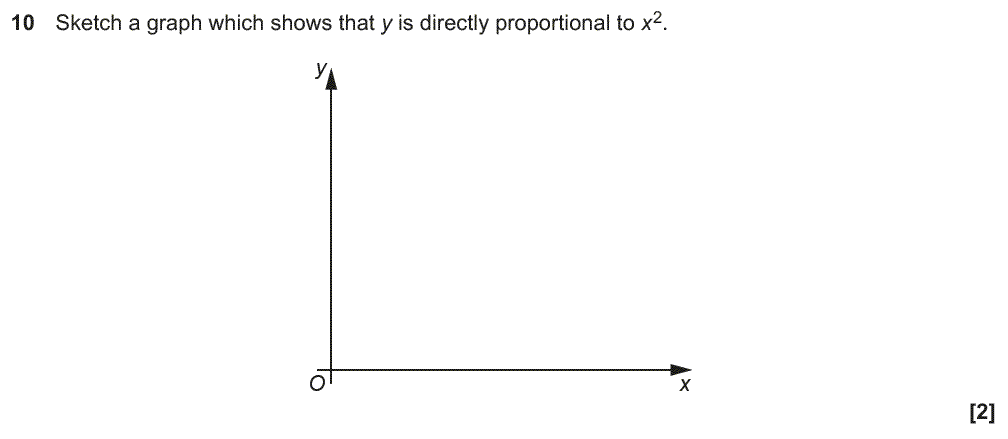
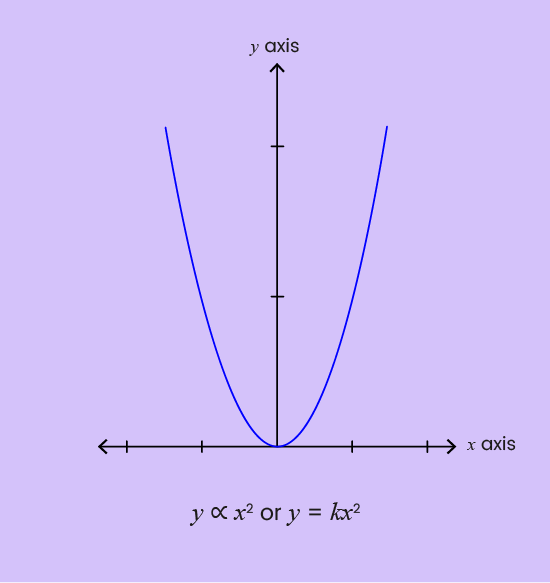
Only Figure A shows that y ∝ x2.
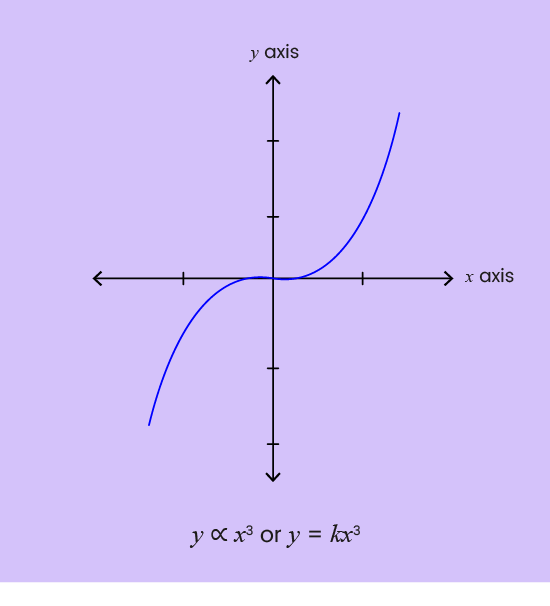
Only Figure C shows that y ∝ √x.
The main topics in GCSE Maths are:
With regular practice of GCSE Maths topic-wise questions and GCSE Maths past pacers, you can easily score high marks.
Although many people think of GCSE maths as a difficult subject, with the correct training and preparation,you can master it in time. You can practice GCSE Maths topic-wise questions daily to improve speed, accuracy, and time and to score high marks in the GCSE Maths exam.
A grade of 4 or 5 would be considered "good" because the government has established a 4 as the passing grade; a grade of 5 is seen as a strong pass. Therefore, anything that exceeds this level would be considered good. You can practice GCSE Maths topic-wise questions to score good grades in the GCSE Maths exam.
You can get a high score in GCSE Maths through meticulous practice of GCSE Maths topic-wise questions and GCSE Maths past papers.


© 2014 - 2024 PiAcademy Limited, All Rights Reserved