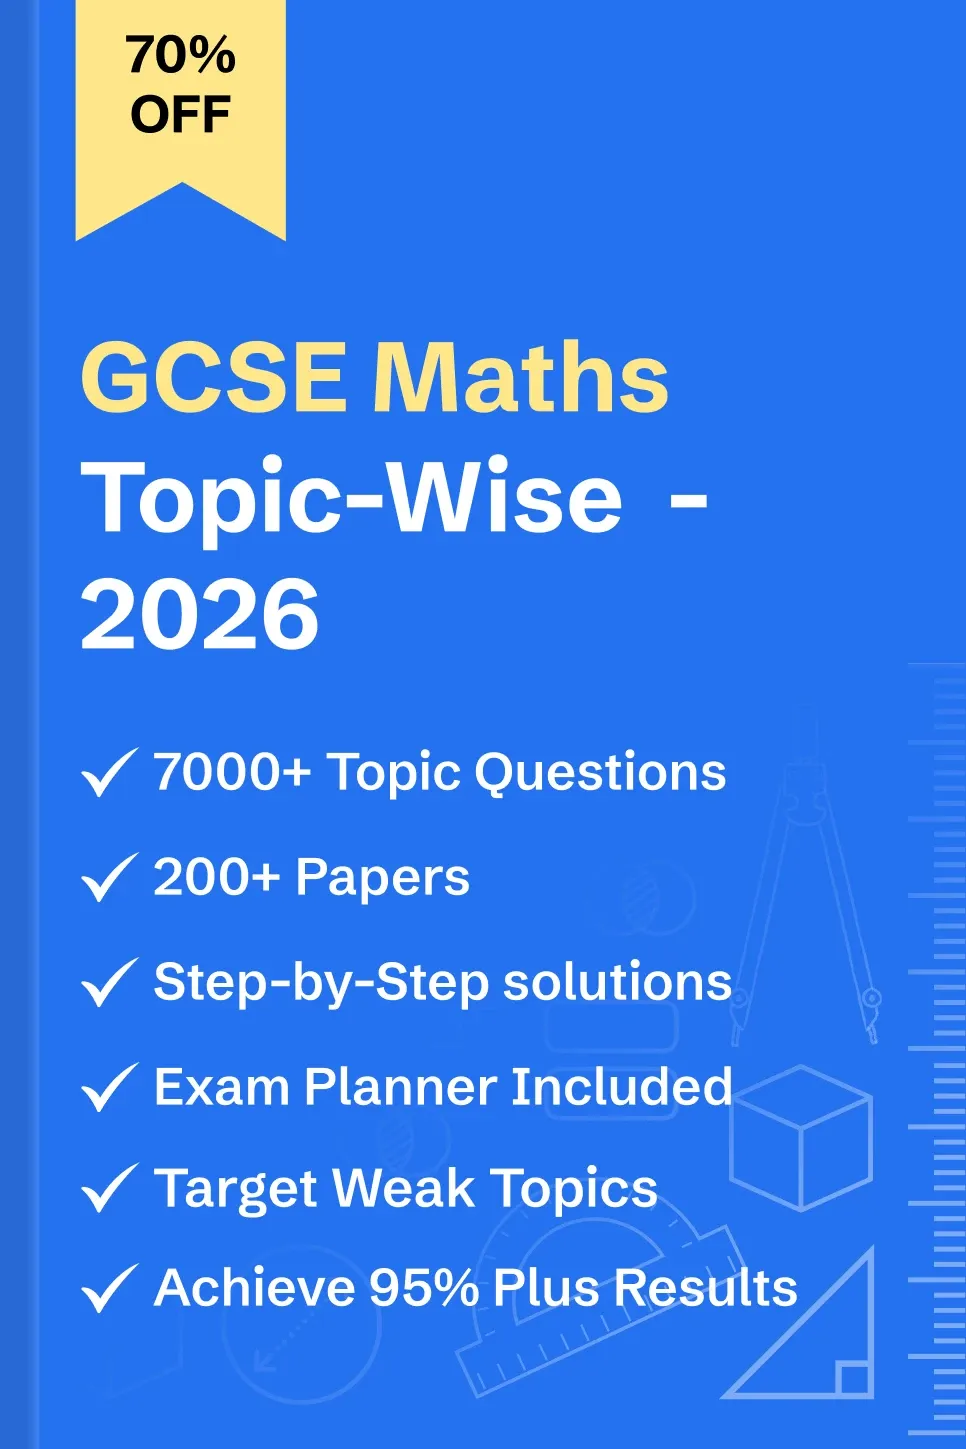
GCSE Solved Topic Wise Questions
5320+
Students
70% OFF
£89/year
Add to Basket
- Practice 7K+ topic-wise questions, tagged by difficulty and time.
- Unlock instantly, 2026, GCSE exams, 200+ Maths Past & Predicted Papers.
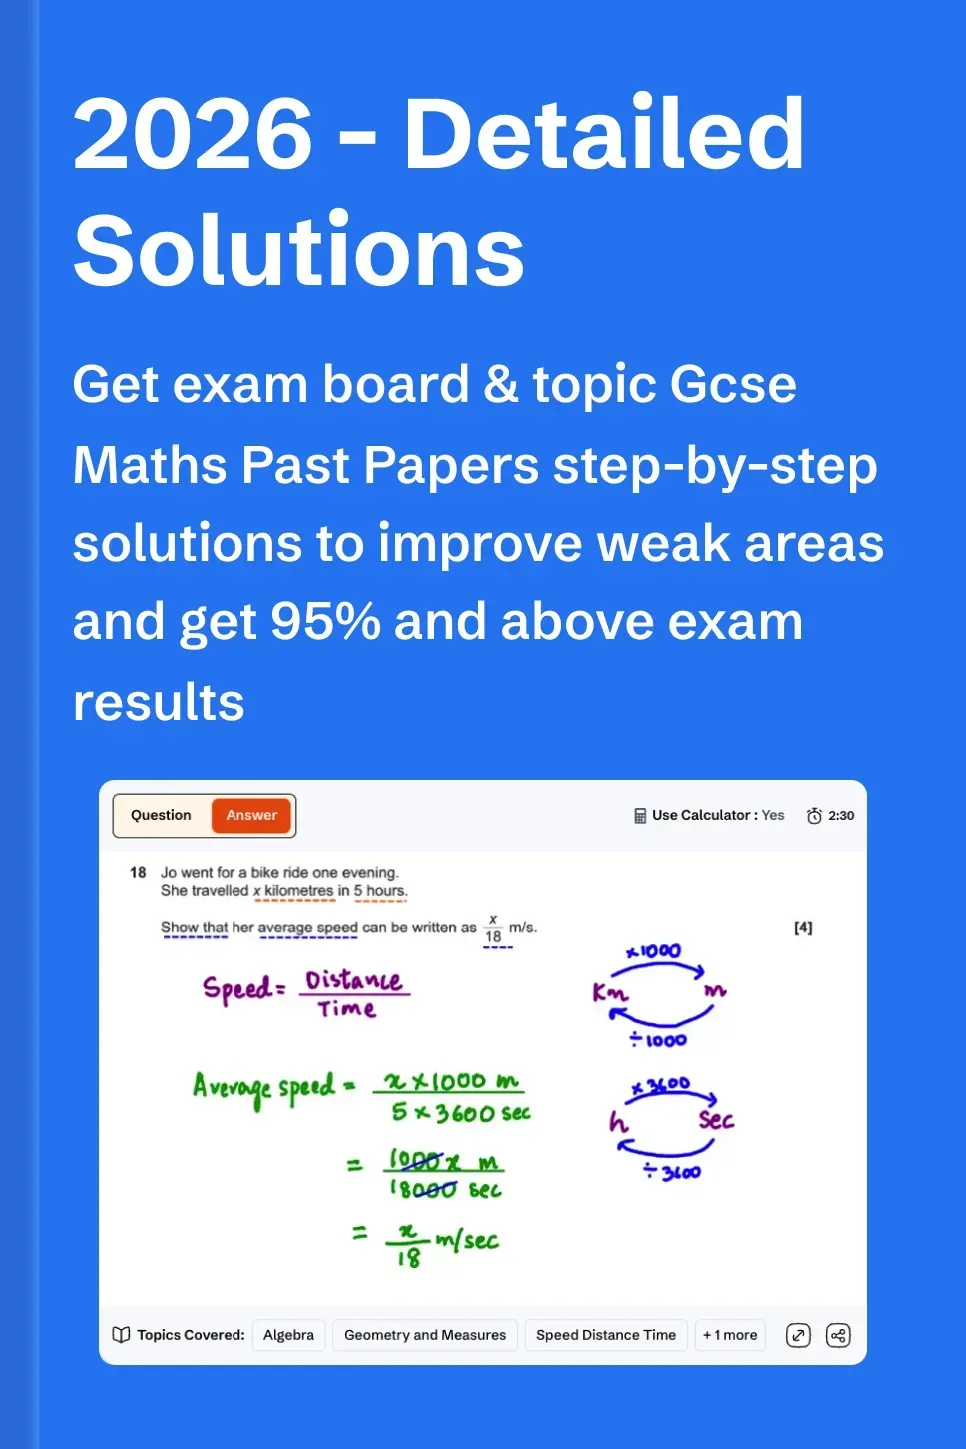
- Access detailed step-wise solutions by GCSE examiners on the website.
- Get full GCSE Maths exam syllabus & download paper planner.
- Boost exam speed, accuracy, & confidence for GCSE exams.
- Suitable for Edexcel, AQA, OCR, WJEC, CCEA & Eduqas boards.
70% OFF
£89/year
Add to Basket
GCSE Exam Topics
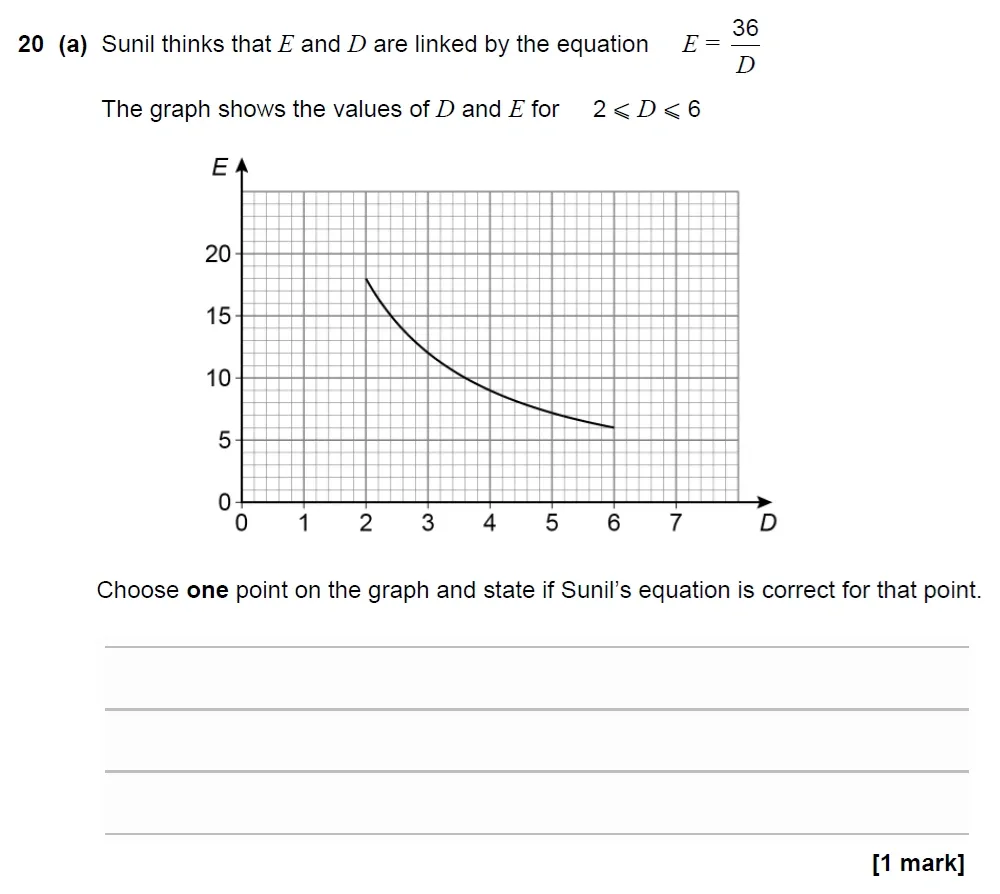
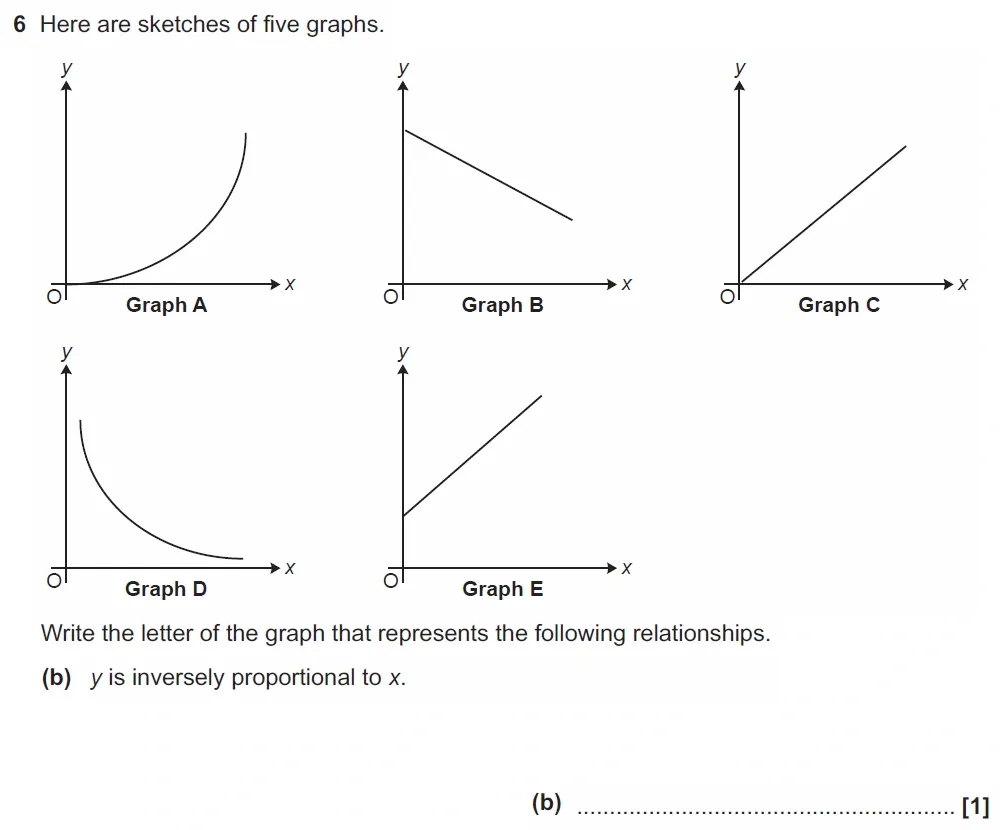
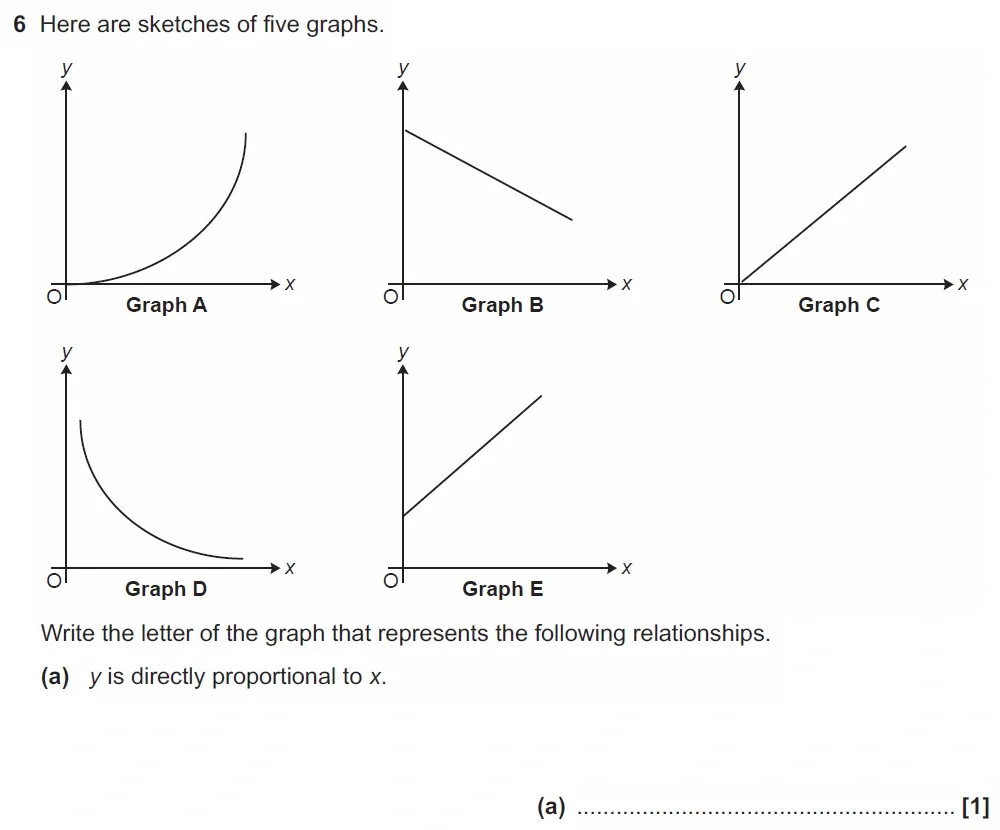
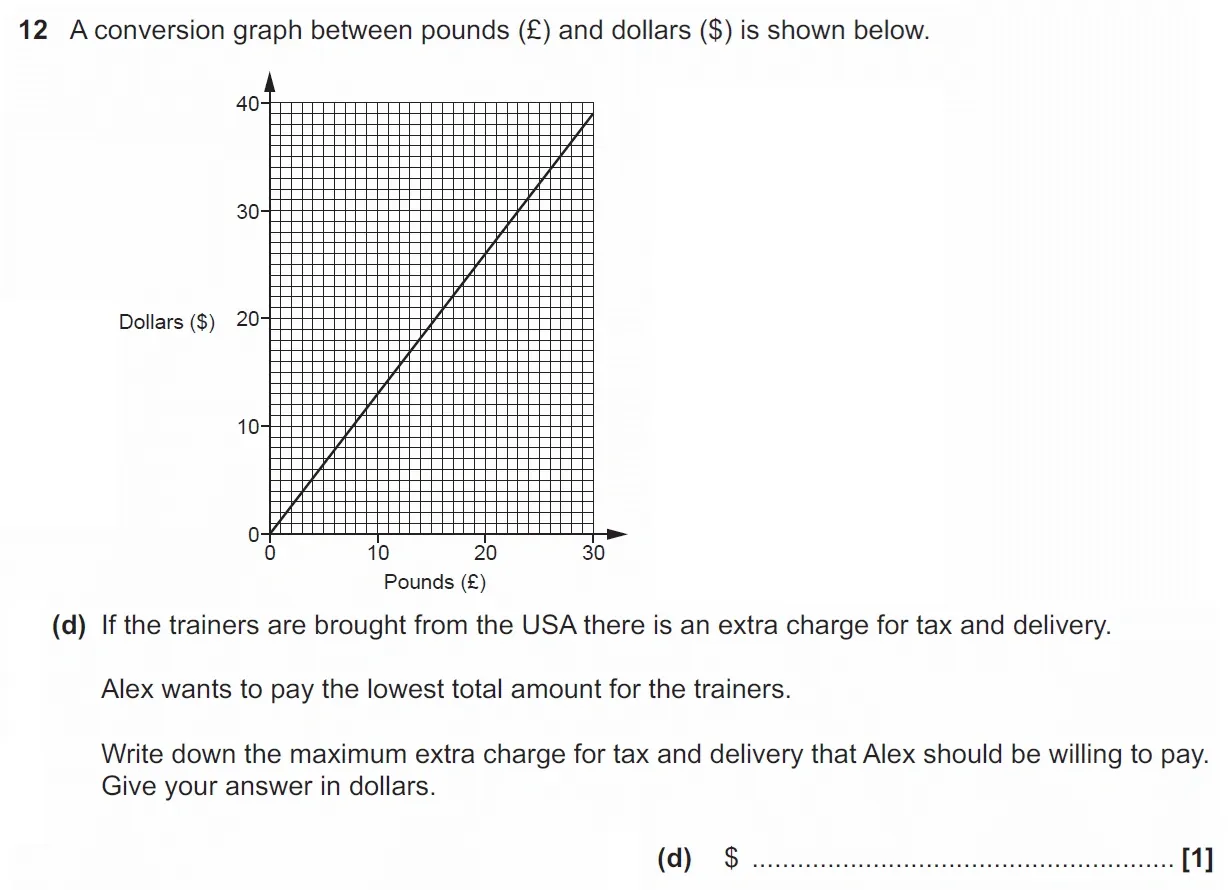
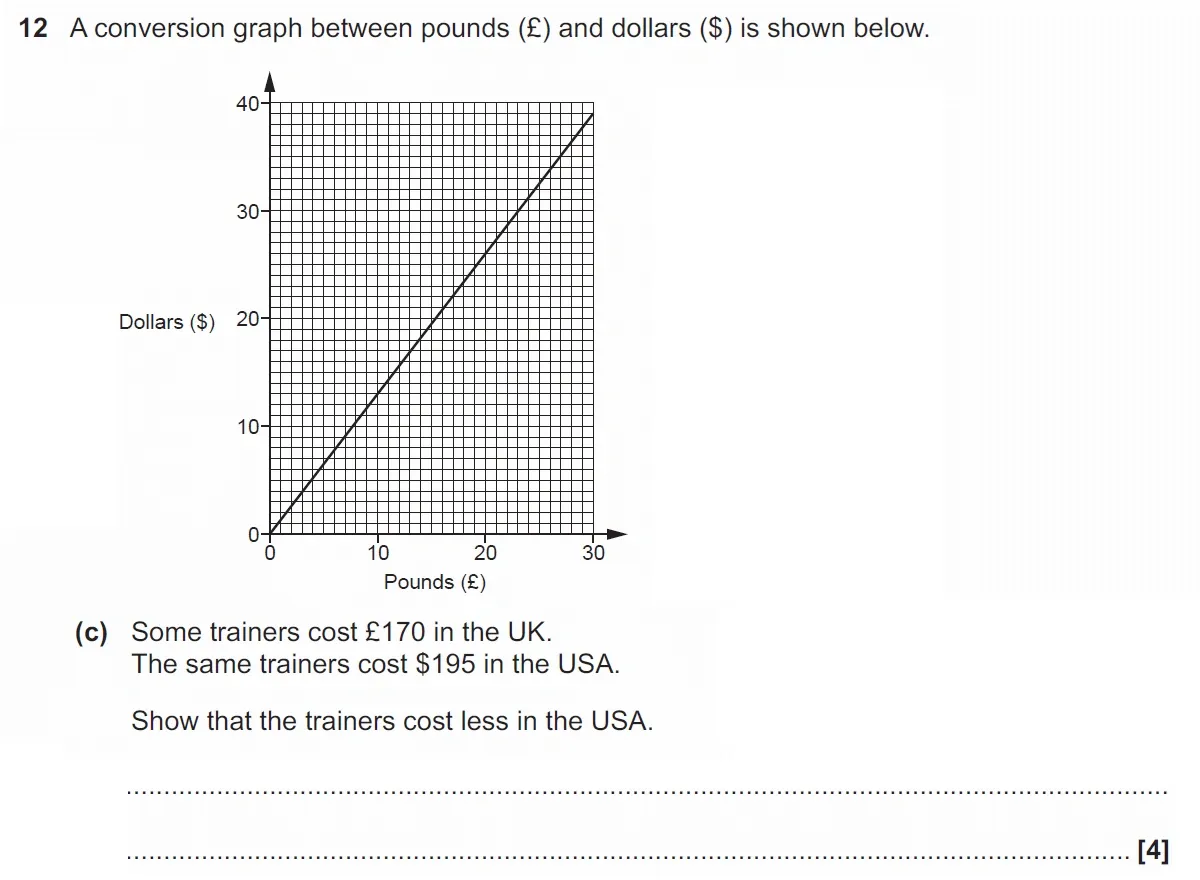
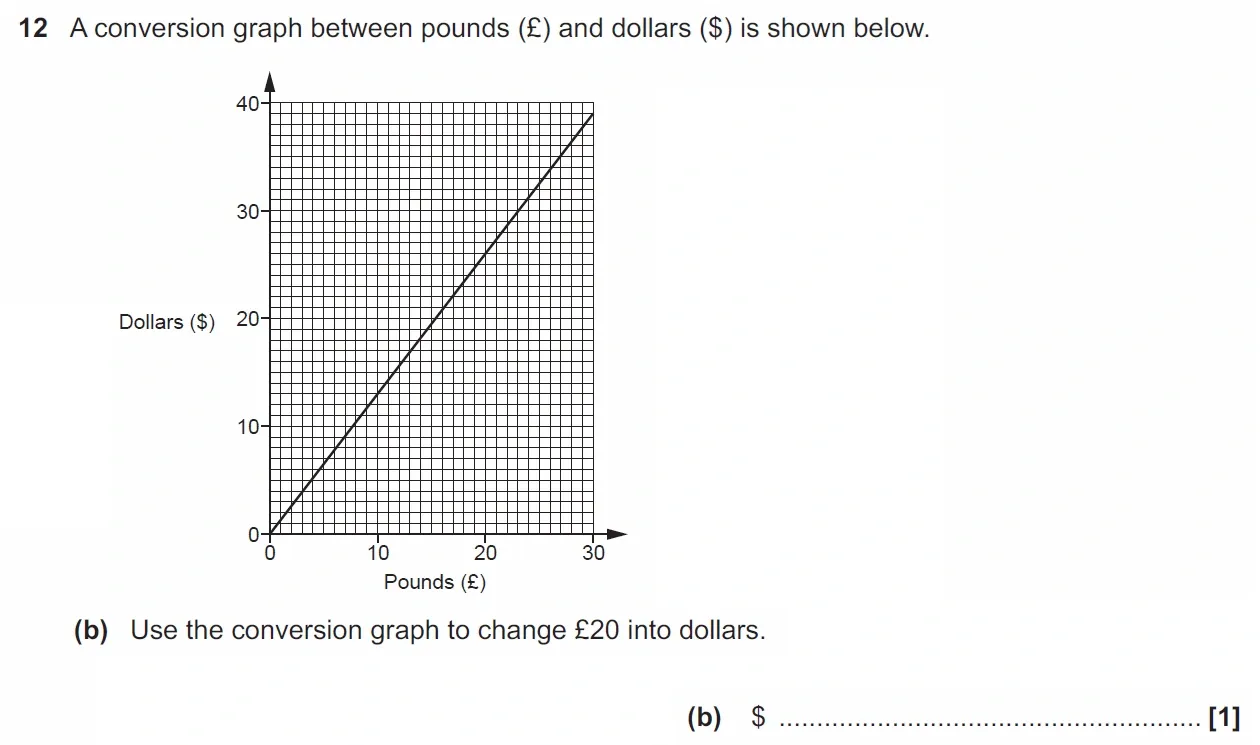
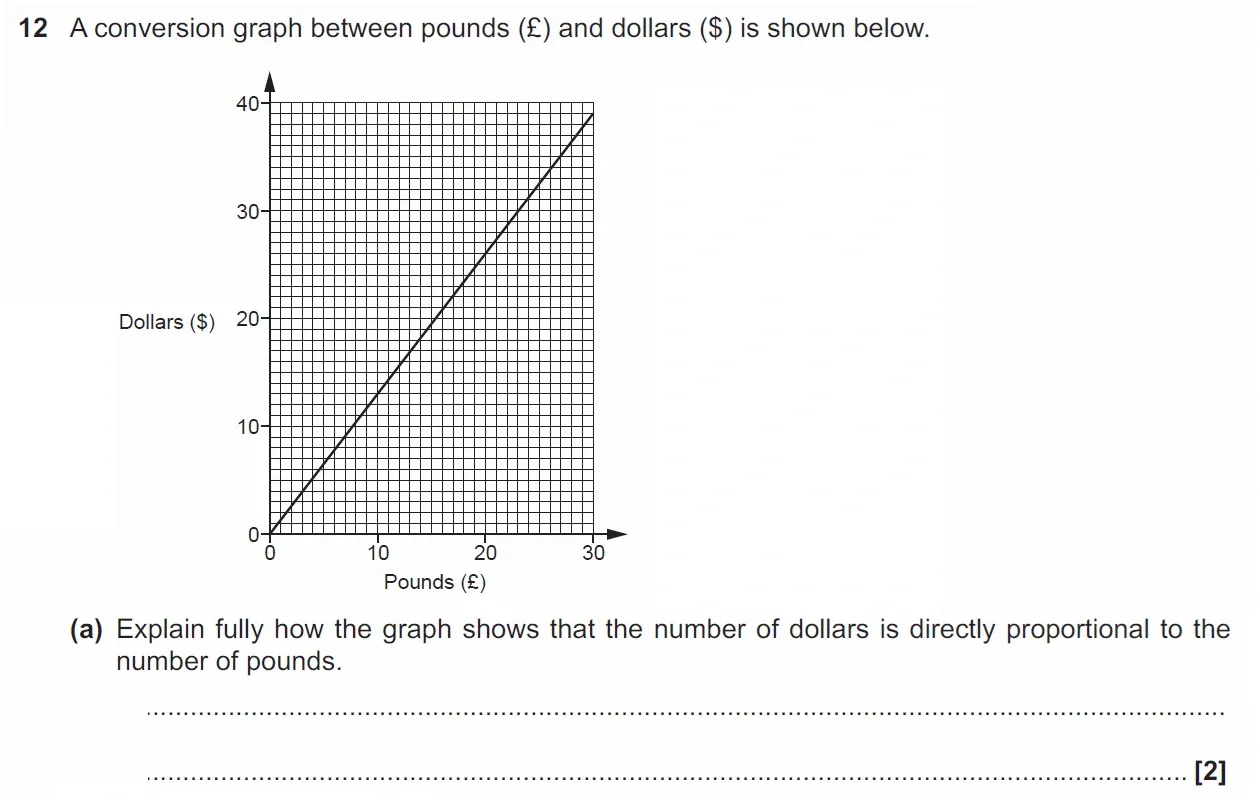
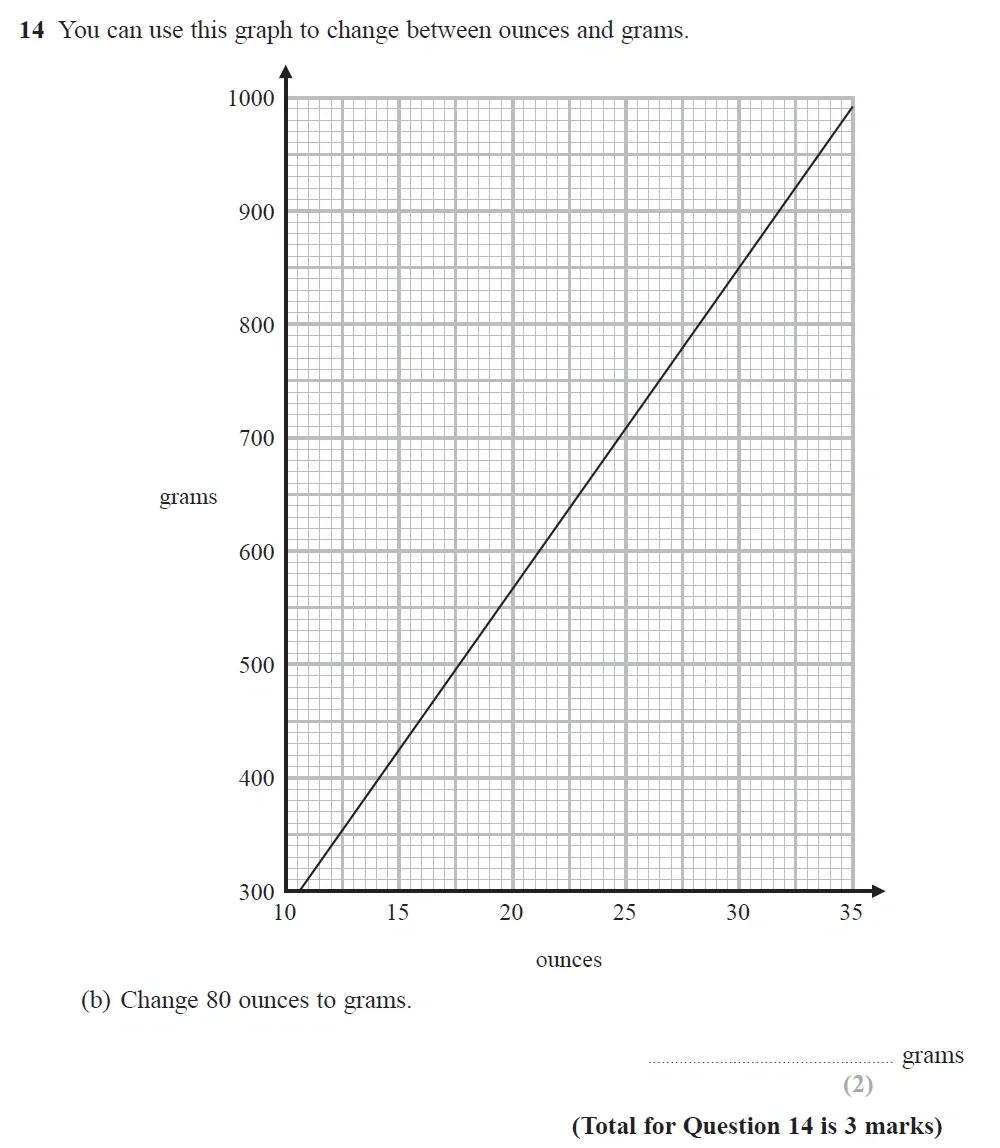
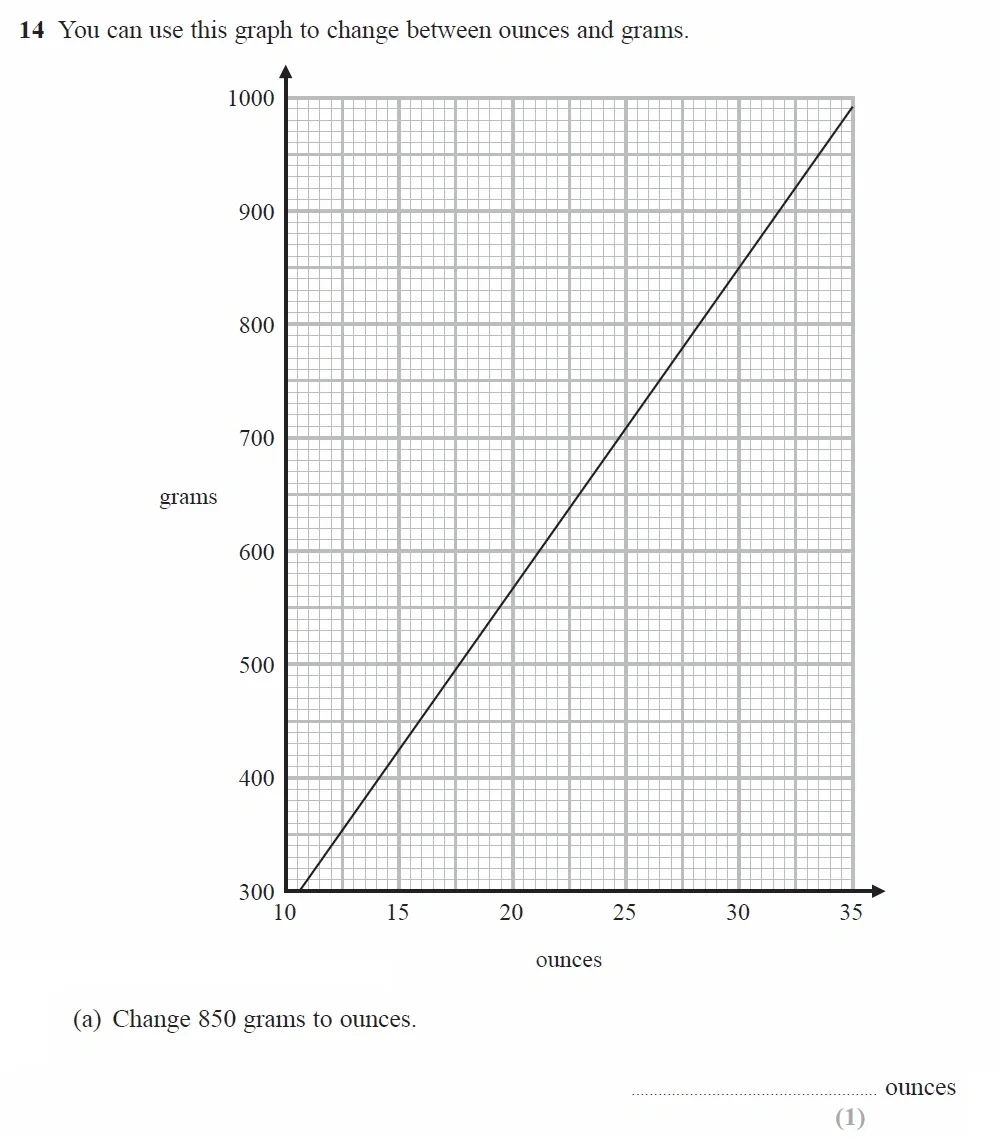
Proportion and Graphs - GCSE Maths Exam Questions & Answers
Use Calculator :Yes
Use Calculator :Yes
1:00
Topics Covered:
Use Calculator :No
Use Calculator :No
0:45
Topics Covered:
Use Calculator :No
Use Calculator :No
0:45
Topics Covered:
Use Calculator :Yes
Use Calculator :Yes
0:45
Topics Covered:
Topics Covered:
Use Calculator :Yes
Use Calculator :Yes
0:45
Topics Covered:
Topics Covered:
Use Calculator :Yes
Use Calculator :Yes
1:00
Topics Covered:
Use Calculator :Yes
Use Calculator :Yes
1:00
Topics Covered:
Use Calculator :Yes

Use Calculator :Yes
1:00
Topics Covered:
Use Calculator :Yes
Use Calculator :Yes
1:00
Topics Covered:
Use Calculator :Yes
Use Calculator :Yes
2:00
Topics Covered:
Topics Covered:
Key Feature of GCSE Solved Topic Wise Questions
Detailed Answers
Step-by-step solutions to GCSE Maths papers designed to build core concepts and boost exam confidence.


Benefits of GCSE Solved Topic Wise Questions

Students
- Stay updated with the 2026 GCSE Maths exam format.
- Targeted Topic-wise Practice with Edexcel, OCR & AQA GCSE Maths past papers.
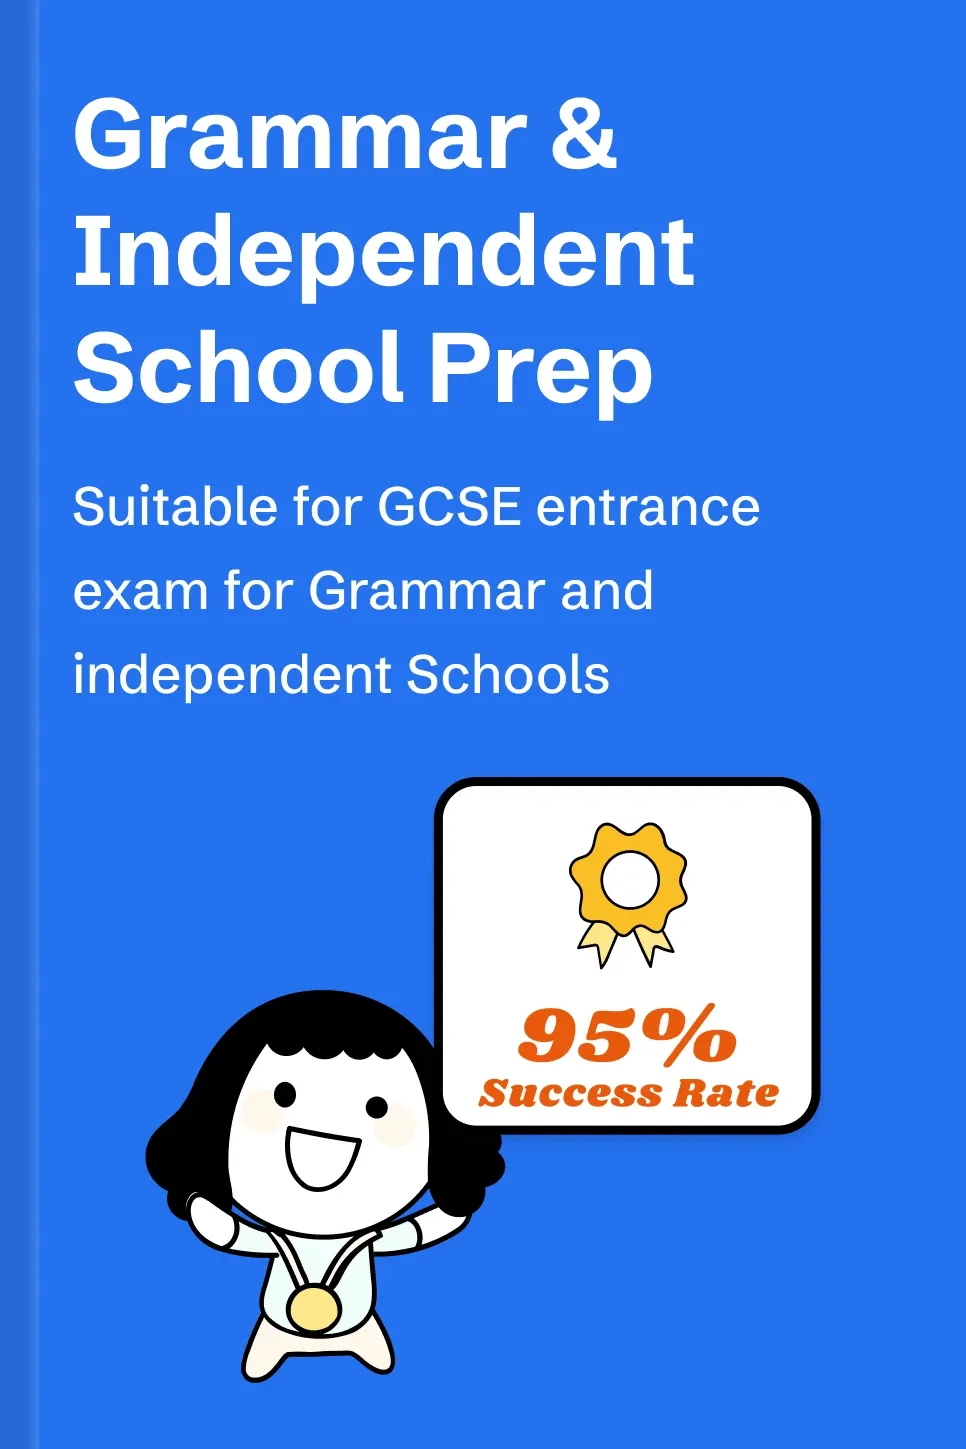
- 95% success rate for all GCSE Boards exams.

Parents
- Track Maths GCSE progress with step-wise answers.
- Affordable, high-quality exam resources for GCSE Maths revision.
- Exam planner to create a study plan.

Tutors & Businesses
- Complete GCSE Maths exam coverage for teaching.
- Timed questions with difficulty level for personalized study materials.
- Evaluate student progress with step-wise solutions and planner.
How to Use of GCSE Solved Topic Wise Questions
Step 1
Select your practice topic
- Select GCSE Maths topic of your choice from the left side menu.
- Create a study plan with the downloadable planner.
Step 2
Mark Your Answers

- Solve GCSE Maths past papers questions under timed conditions.
- Mark your answers with the answer explanation provided.
Step 3
Track the progress

- Identify and work on weak GCSE Maths questions.
- Solve 200+ GCSE maths past papers and Answers (Complimentary Access).

