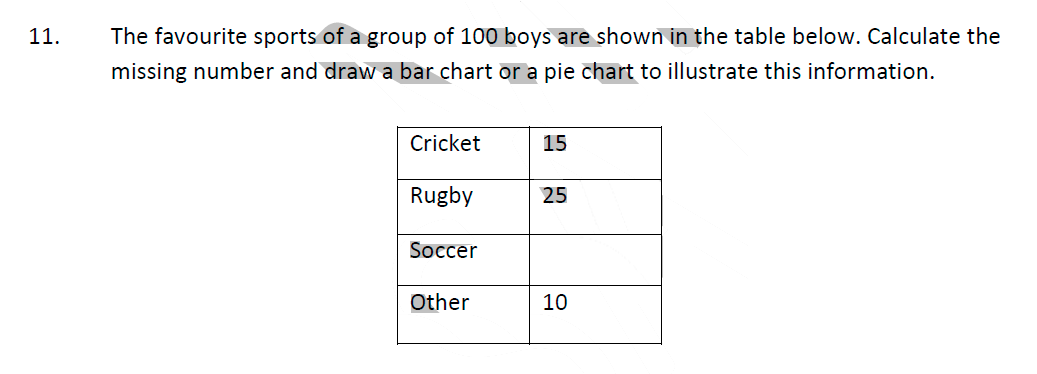
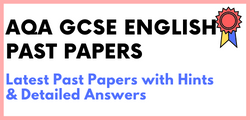
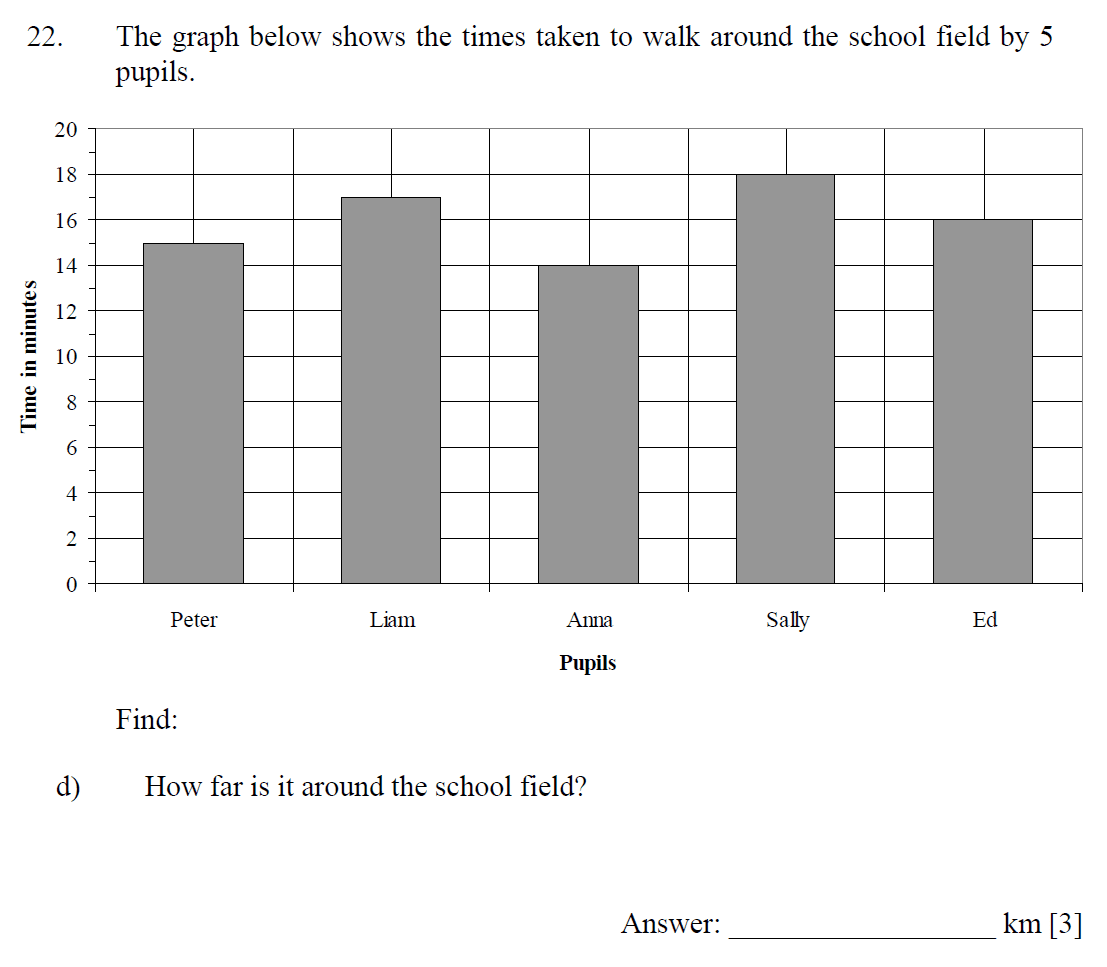
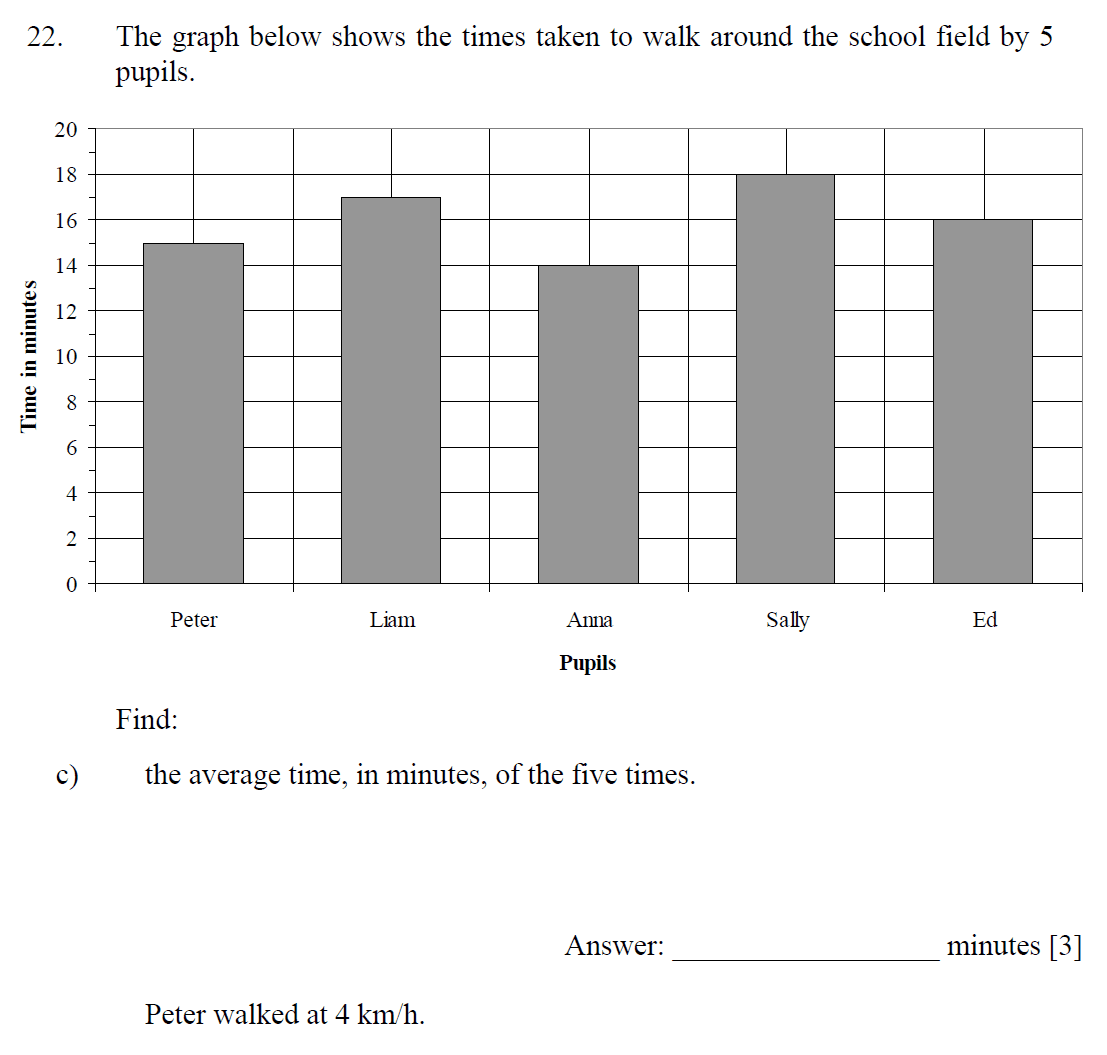
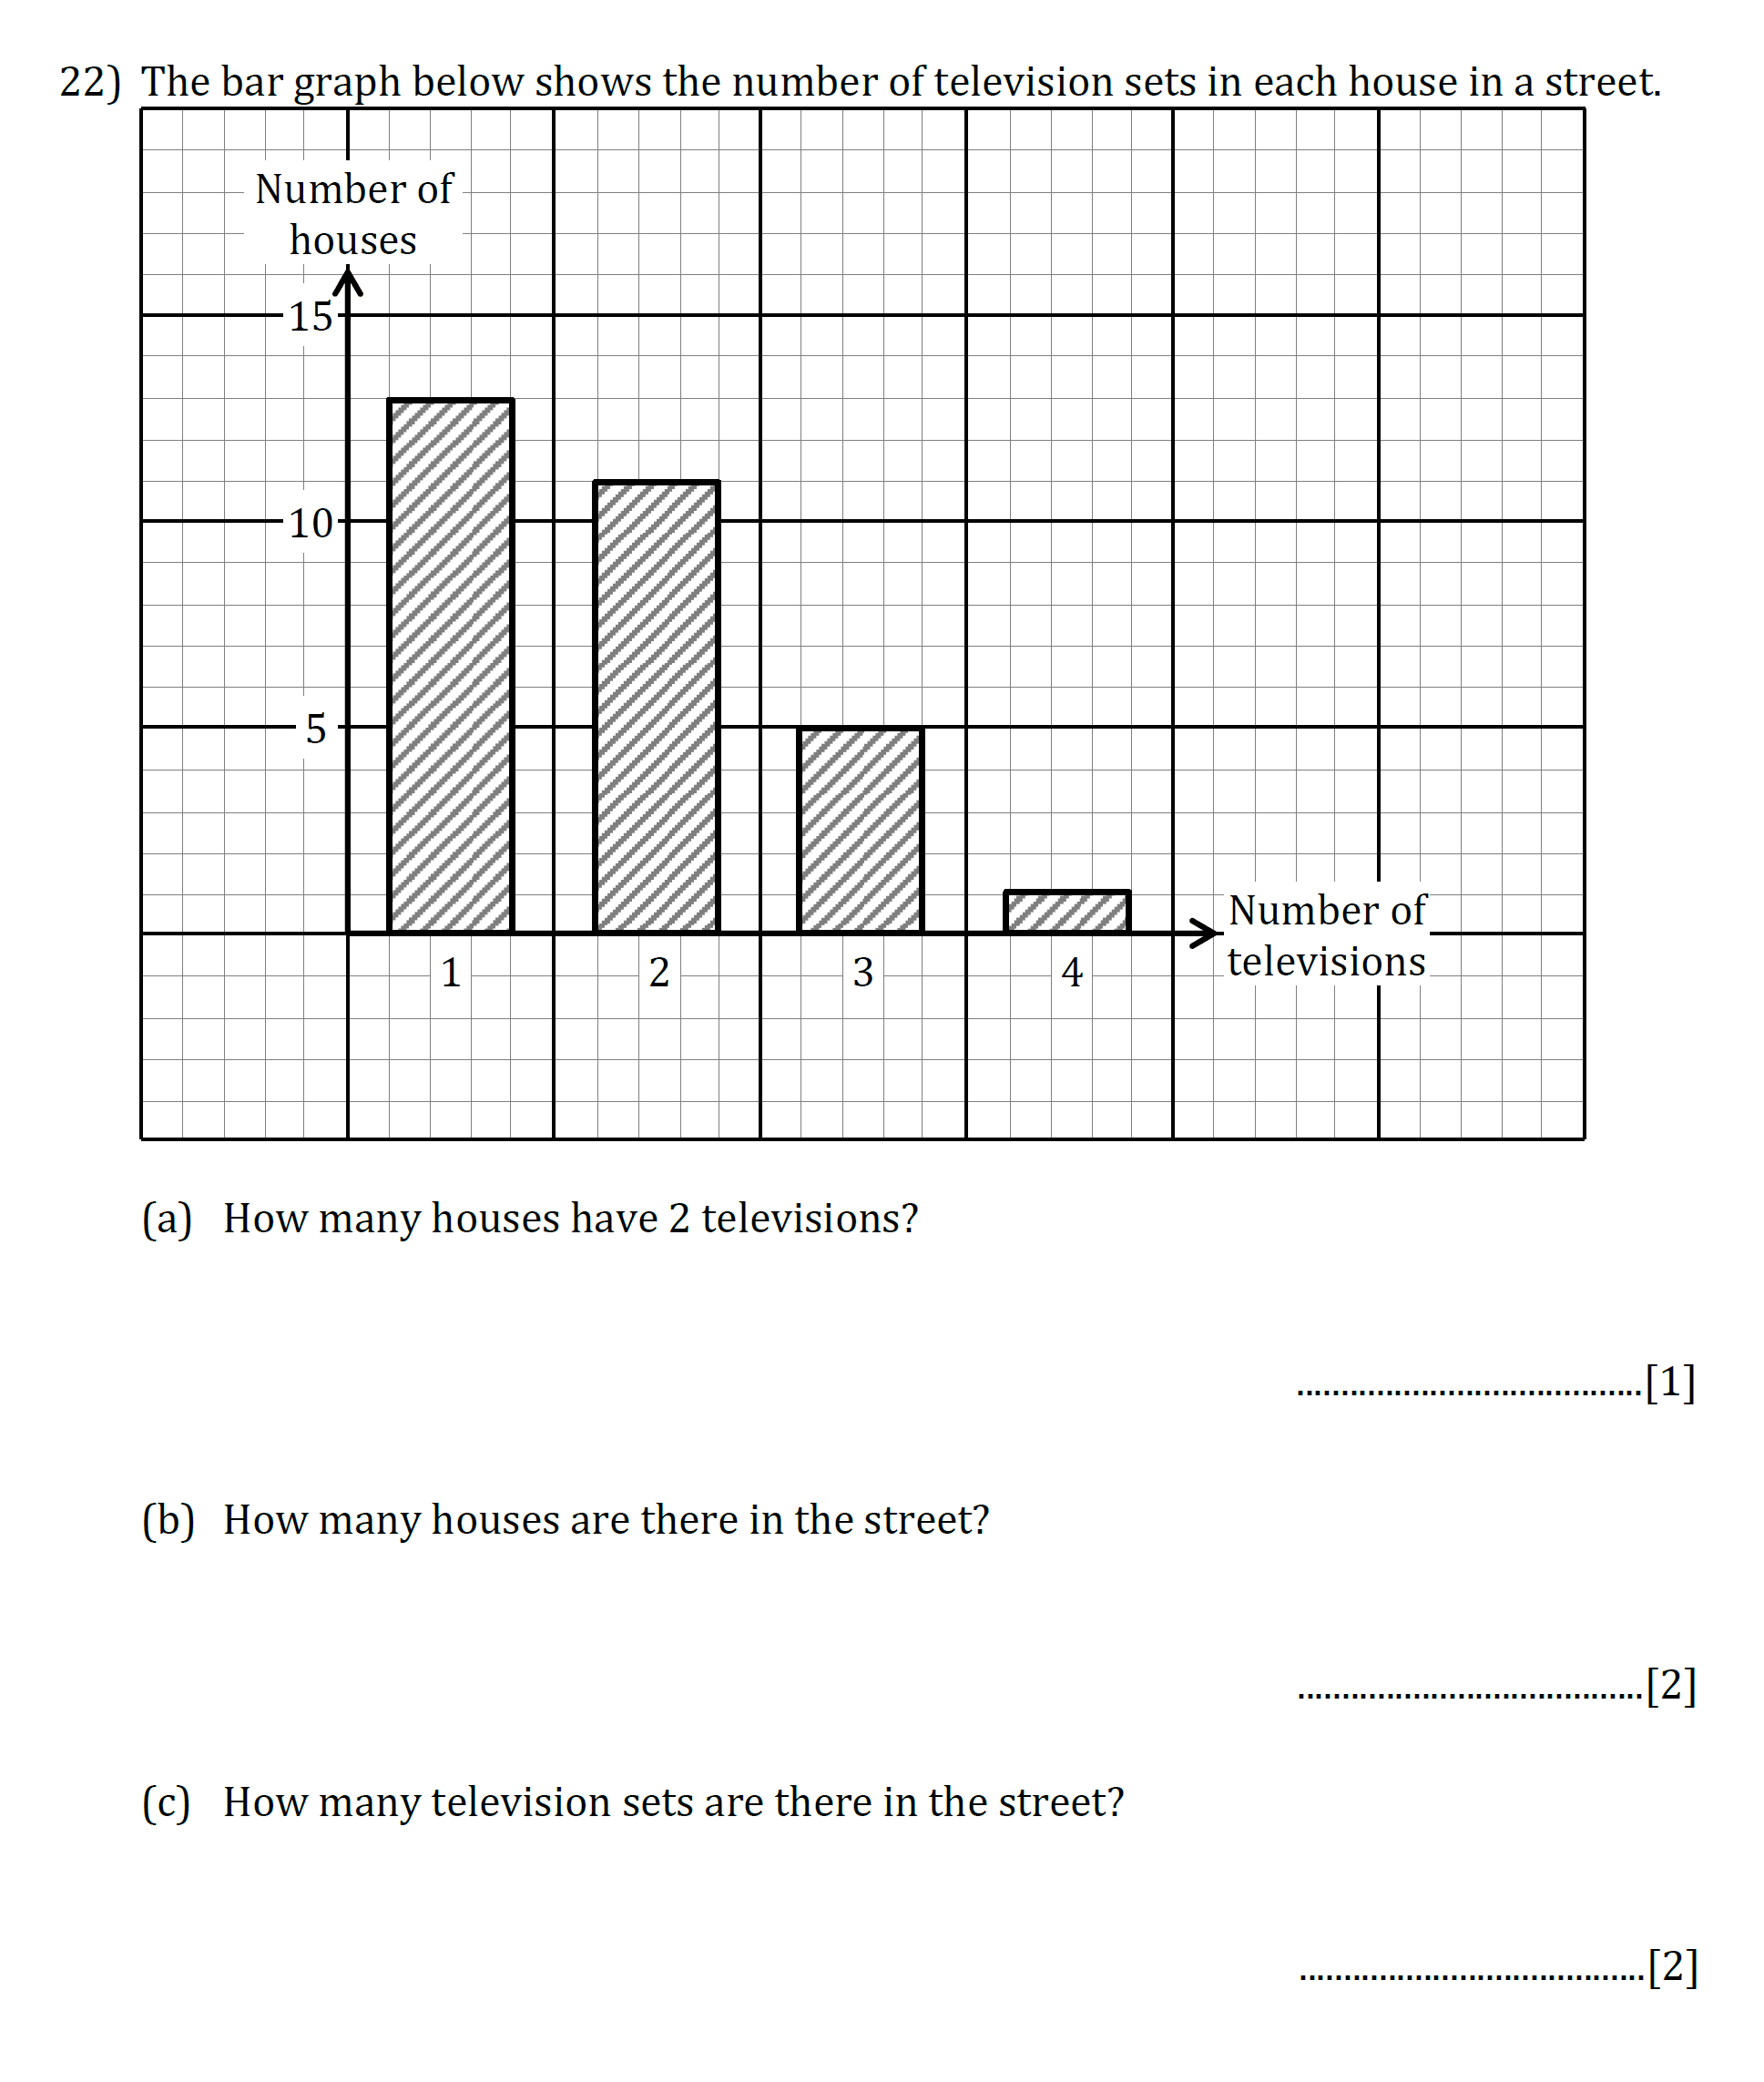
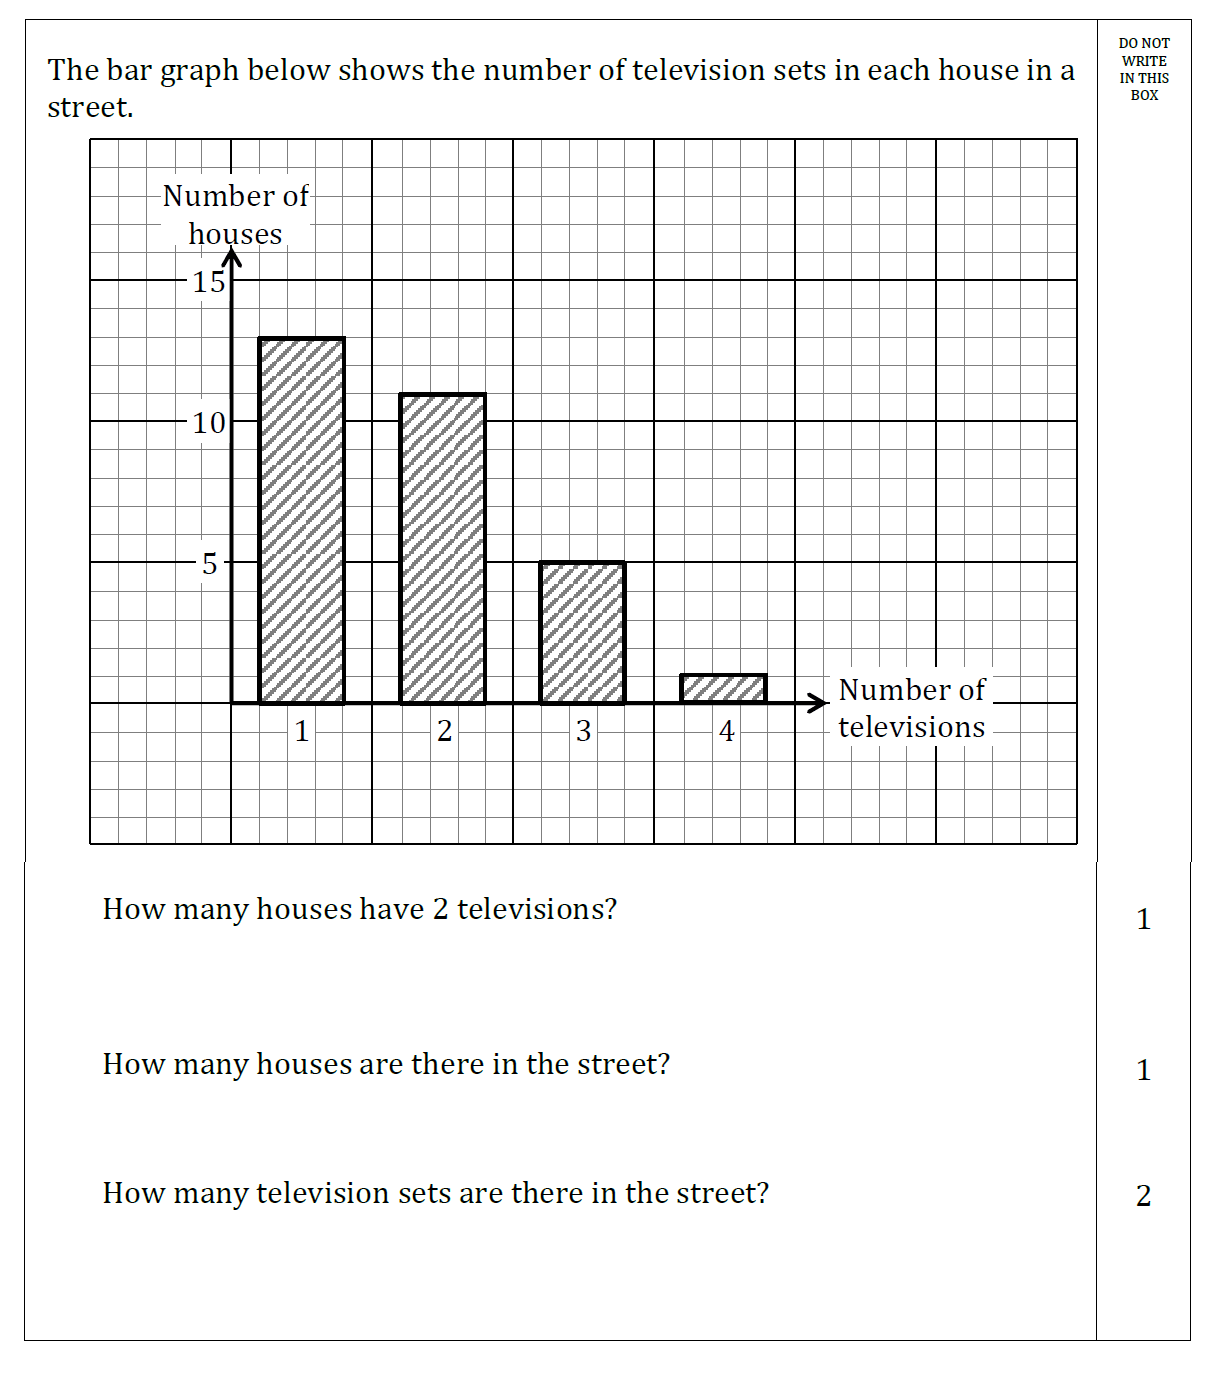
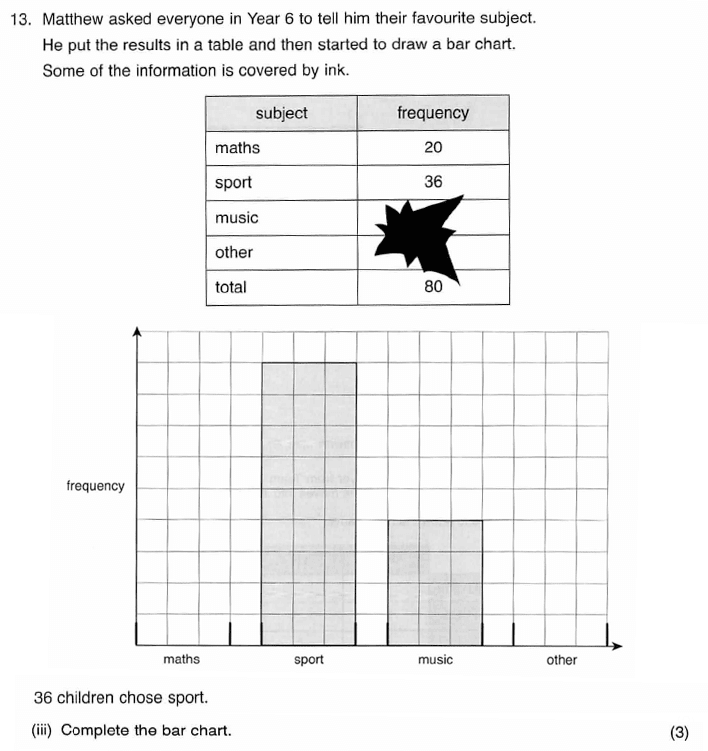
Question
Answer
Solve in:
1 min
Tags:


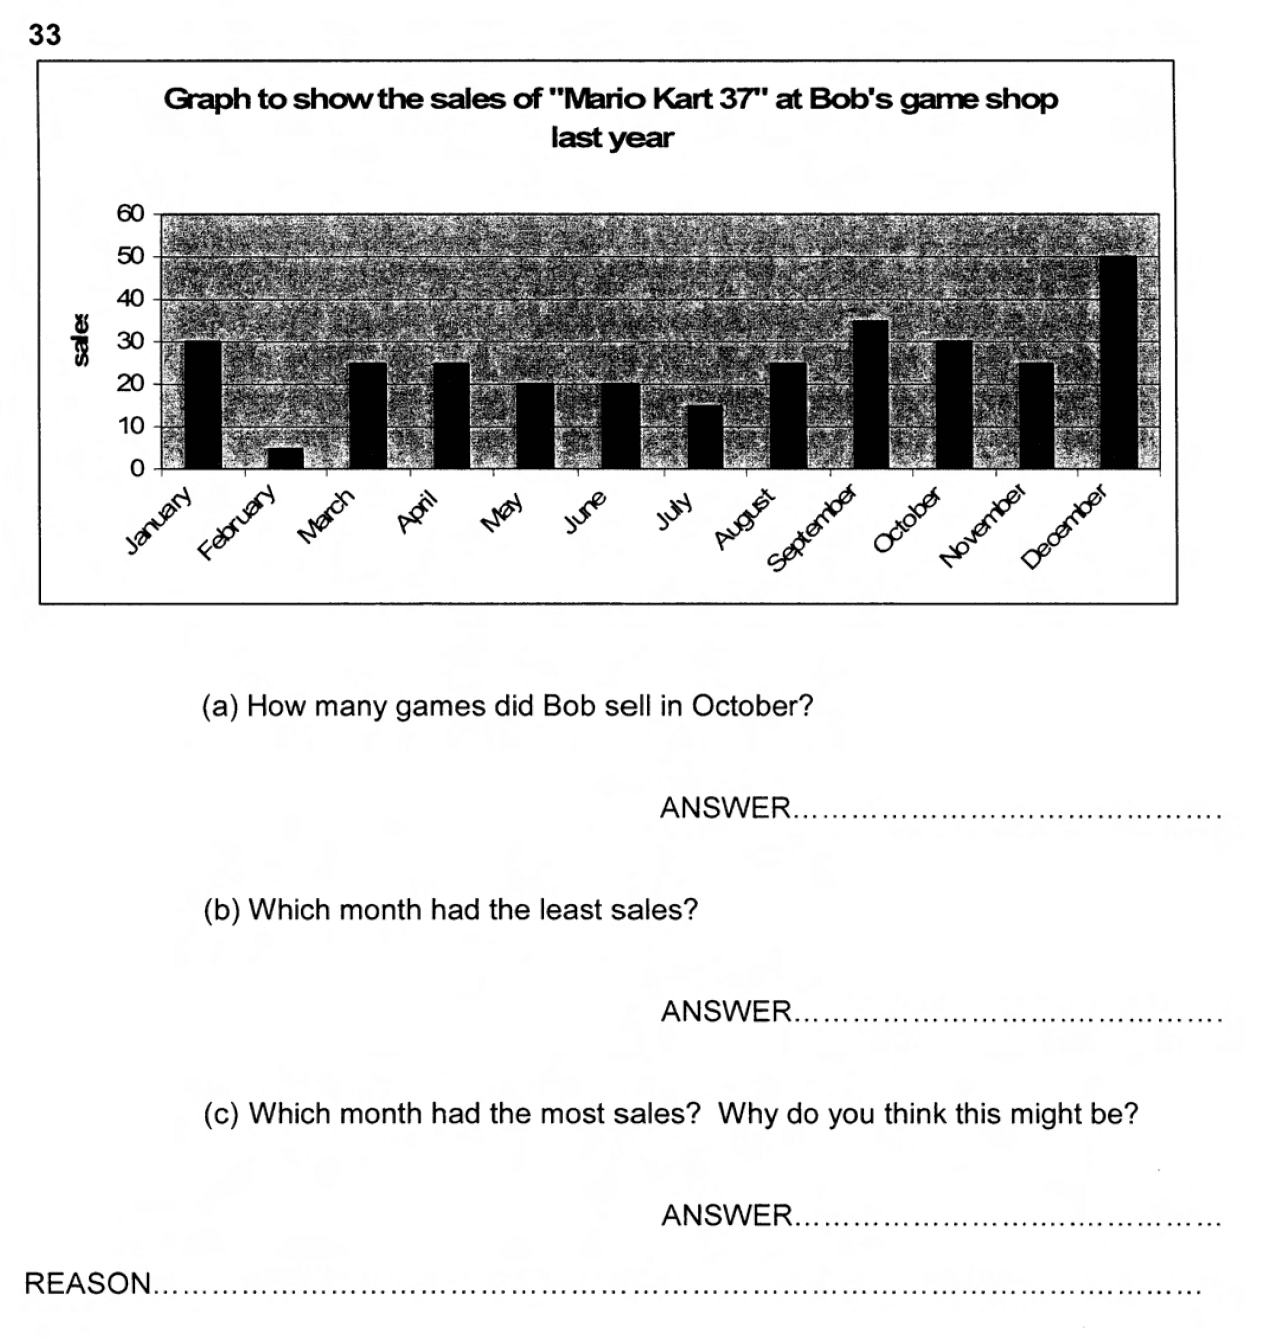
Bar Charts or Bar Graphs are another method of displaying data from a frequency table. A Bar Graph is a simple way to show and compare information.. The data is represented in the form of bars, the value of which can be read from the frequency information shown at the side of the chart, along the vertical axis. The height of the bar shows the amount.
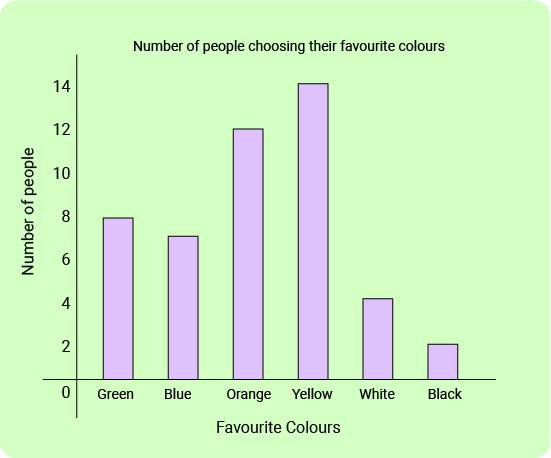
For example, the following bar graph below shows the number of people choosing their favourite colour during a survey last week. We can see that the bar charts have gaps between the bars and everything (including the axes and chart title) is clearly labelled.
The height of the bar is proportional to the measured number or frequency.
Example:
A survey was conducted by questioning 100 students about their mode of transport to school. The results of this survey are recorded in the graph below.
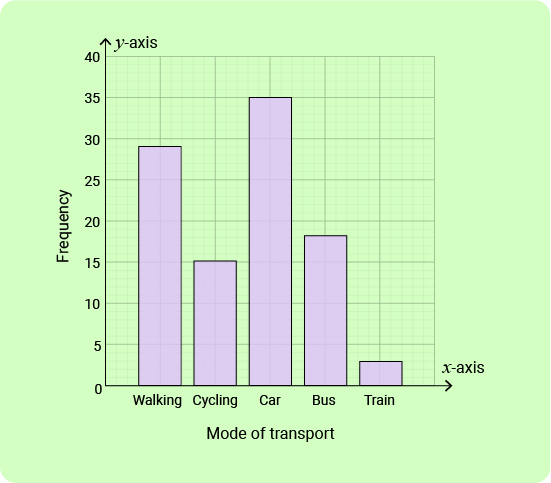
Which mode of transport has the highest frequency?
Solution :
From the graph, the tallest bar is of frequency 35, and the mode of transport for the same is shown in x-axis as a car.
Example:
Here is a bar chart showing the number of goals scored in a game by a football team in a season.
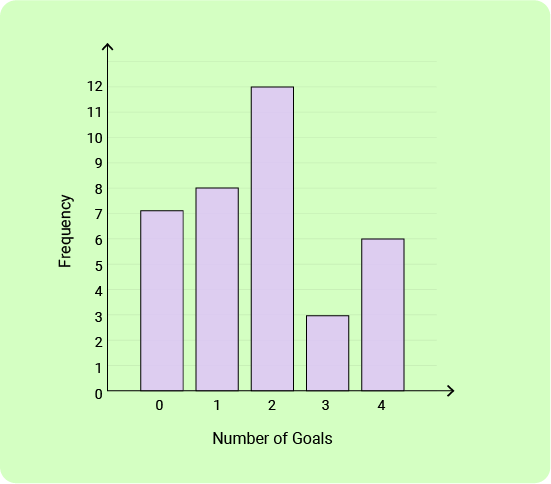
Workout the total number of goals scored in total by the team?
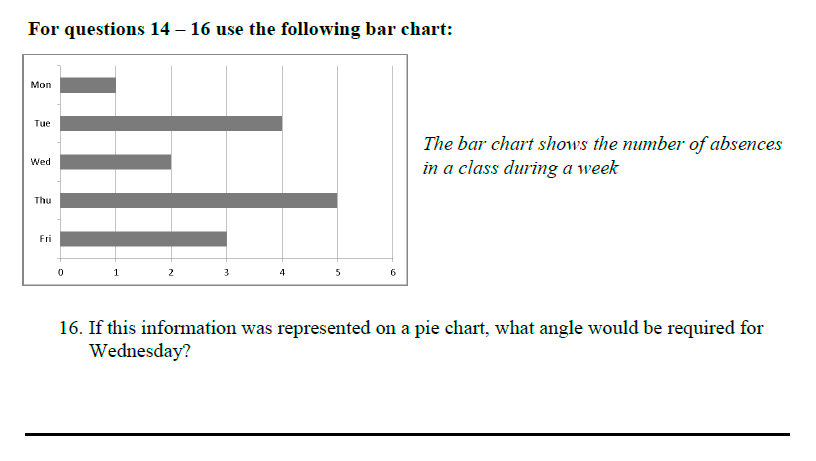
Solution:
We multiply the values of each bar and add them to get the total goals scored
7 × 0 = 0
8 × 1 = 8
12 × 2 = 24
3 × 3 = 9
6 × 4 = 24
Total number of goals scored = 0 + 8 + 24 + 9 + 24 = 65

What counts as a "good" score will vary depending on the school you want to attend. The standardized 11 Plus test score average across the country is roughly 100. The highest average in some areas is 111. The lowest scores would often fall between 60 and 70, while the highest scores would normally fall between 130 and 140. To achieve excellent marks on 11+ Maths Exams, practice 11+ Maths topic-wise questions.
The best way to prepare for the 11+ Maths Exam is by practicing 11+ Maths topic-wise questions regularly.
Maths online subscriptions are “Non-Refundable“. No refunds can be issued for any reason. This is because of the nature of digital products.
You should, therefore, make sure that the Maths online subscriptions fulfil your needs before you subscribe.
As these are digital products, we advise parents to go through our Free Past Papers provided on our website and once decided they can buy subscriptions.
The majority of the 11 Plus Maths questions are mathematical problem-solving, where pupils need to understand and apply mathematical concepts. With regular practice of 11+ Maths Topic-wise questions, you will pass the 11-plus Maths Exam with a high score.
The children must master the following topics for the 11 plus exams
Get 10,000+ Topic-wise questions by subscribing to our 11+ Maths Topic-wise questions. These questions are collected from 180+ Maths past papers.
11 Plus Maths Past Papers Subscription
Any PiAcademy Memberships are for 1 year (366 days), We give Instant unlock to all exam Resources So that you can plan your 11+ Preparation according to your convenience and as per our Planner Spreadsheets.
Hurry! 11+ Exams are approaching in 6 months. High competition. Most parents fail to do structured planning for the 11+ Exam preparation.
Get a plan and strategy from 11+ Expert Tutors. Avoid the common mistakes that other parents make.


© 2014 - 2025 PiAcademy Limited, All Rights Reserved