Reviews
11+ Maths Solved Topic Wise Questions
  • Master weak areas with 10,000+ Questions & Answers
  • Best for 11+ Grammar & Independent School Exams
  • Improve Speed, Accuracy & Time Management
  • Includes 180, Maths Solved Past Papers
1 Year
Full Access
10,000+
Topicwise Questions
180
Solved 11+ Maths Papers

Pictograms Questions and Answers

Question
Answer

These detailed answers are visible only for premium members

Please register to unlock over one hundred and sixty 11+ Exam Papers. 10,000+ Questions with Answers


Register


Login

Solve in:
2 min
Question
Answer
Question 37 Haberdashers Monmouth Girls School HABS Entrance Examination 2015

These detailed answers are visible only for premium members

Please register to unlock over one hundred and sixty 11+ Exam Papers. 10,000+ Questions with Answers


Register


Login

Solve in:
1 min 15 sec
Question
Answer
Question 36 Haberdashers Monmouth Girls School HABS Entrance Examination 2015

These detailed answers are visible only for premium members

Please register to unlock over one hundred and sixty 11+ Exam Papers. 10,000+ Questions with Answers


Register


Login

Solve in:
1 min
Question
Answer
Question 09 - Merchant Taylors School 11 Plus Maths Specimen Paper 2

These detailed answers are visible only for premium members

Please register to unlock over one hundred and sixty 11+ Exam Papers. 10,000+ Questions with Answers


Register


Login

Solve in:
1 min 30 sec
Question
Answer

These detailed answers are visible only for premium members

Please register to unlock over one hundred and sixty 11+ Exam Papers. 10,000+ Questions with Answers


Register


Login

Solve in:
1 min 30 sec
Question
Answer
Question 07 - St Johns School 11 Plus Maths Exam Sample Paper

These detailed answers are visible only for premium members

Please register to unlock over one hundred and sixty 11+ Exam Papers. 10,000+ Questions with Answers


Register


Login

Solve in:
4 min
Question
Answer

These detailed answers are visible only for premium members

Please register to unlock over one hundred and sixty 11+ Exam Papers. 10,000+ Questions with Answers


Register


Login

Solve in:
2 min 15 sec
Question
Answer
Group 2 Maths 2017 - Question 25

These detailed answers are visible only for premium members

Please register to unlock over one hundred and sixty 11+ Exam Papers. 10,000+ Questions with Answers


Register


Login

Solve in:
10 sec
Question
Answer
Blackheath High School Year 7 Practice Paper 2007 - Question 07

These detailed answers are visible only for premium members

Please register to unlock over one hundred and sixty 11+ Exam Papers. 10,000+ Questions with Answers


Register


Login

Solve in:
32 sec
Question
Answer
Blackheath High School Year 7 Practice Paper 2007 - Question 06

These detailed answers are visible only for premium members

Please register to unlock over one hundred and sixty 11+ Exam Papers. 10,000+ Questions with Answers


Register


Login

Solve in:
48 sec
Question
Answer
ISEB 11 Plus Maths 2008-09 Practice Paper Question 10

These detailed answers are visible only for premium members

Please register to unlock over one hundred and sixty 11+ Exam Papers. 10,000+ Questions with Answers


Register


Login

Solve in:
1 min 30 sec
Question
Answer
ISEB 11 Plus Maths 2008-09 Practice Paper Question 09

These detailed answers are visible only for premium members

Please register to unlock over one hundred and sixty 11+ Exam Papers. 10,000+ Questions with Answers


Register


Login

Solve in:
1 min 30 sec
Question
Answer
Aldenham School - 11+ Maths Sample Paper 2019 Question 12, Statistics, Pictograms, Logical Problems

These detailed answers are visible only for premium members

Please register to unlock over one hundred and sixty 11+ Exam Papers. 10,000+ Questions with Answers


Register


Login

Solve in:
1 min
Question
Answer
James Allen’s Girls’ School - 11+ Maths Sample Paper 1 - 2020 Question 21, Statistics, Pictograms, Logical Problems

These detailed answers are visible only for premium members

Please register to unlock over one hundred and sixty 11+ Exam Papers. 10,000+ Questions with Answers


Register


Login

Solve in:
2 min 30 sec
Question
Answer
11 Plus Maths Independent Style Mock Test 2020 Question 28

These detailed answers are visible only for premium members

Please register to unlock over one hundred and sixty 11+ Exam Papers. 10,000+ Questions with Answers


Register


Login

Solve in:
2 min 30 sec
Question
Answer
Statistics, Pictograms

These detailed answers are visible only for premium members

Please register to unlock over one hundred and sixty 11+ Exam Papers. 10,000+ Questions with Answers


Register


Login

Solve in:
1 min
Question
Answer
Pictograms, Fractions and Percentages

These detailed answers are visible only for premium members

Please register to unlock over one hundred and sixty 11+ Exam Papers. 10,000+ Questions with Answers


Register


Login

Solve in:
1 min 30 sec
Question
Answer
Pictograms

These detailed answers are visible only for premium members

Please register to unlock over one hundred and sixty 11+ Exam Papers. 10,000+ Questions with Answers


Register


Login

Solve in:
1 min

Understanding Pictograms for 11 Plus Exams

1.What is a pictogram?

A pictogram is a chart that uses pictures or symbols to represent data. Every pictogram has a key that shows the value of each symbol or picture. A pictogram design can be constructed using a table with two columns. In the first column is the name of the group, and the second column features the pictures.

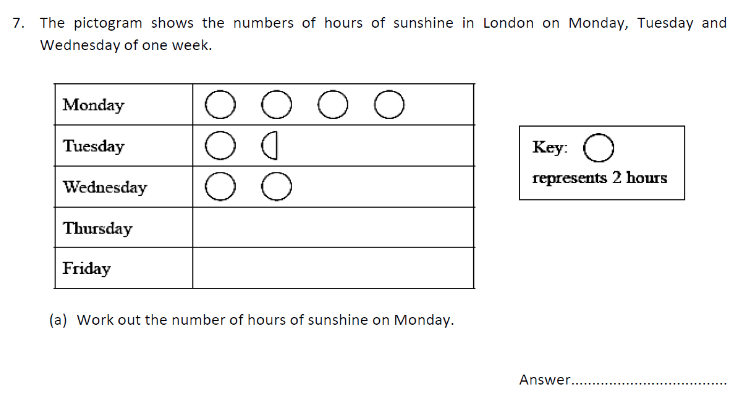
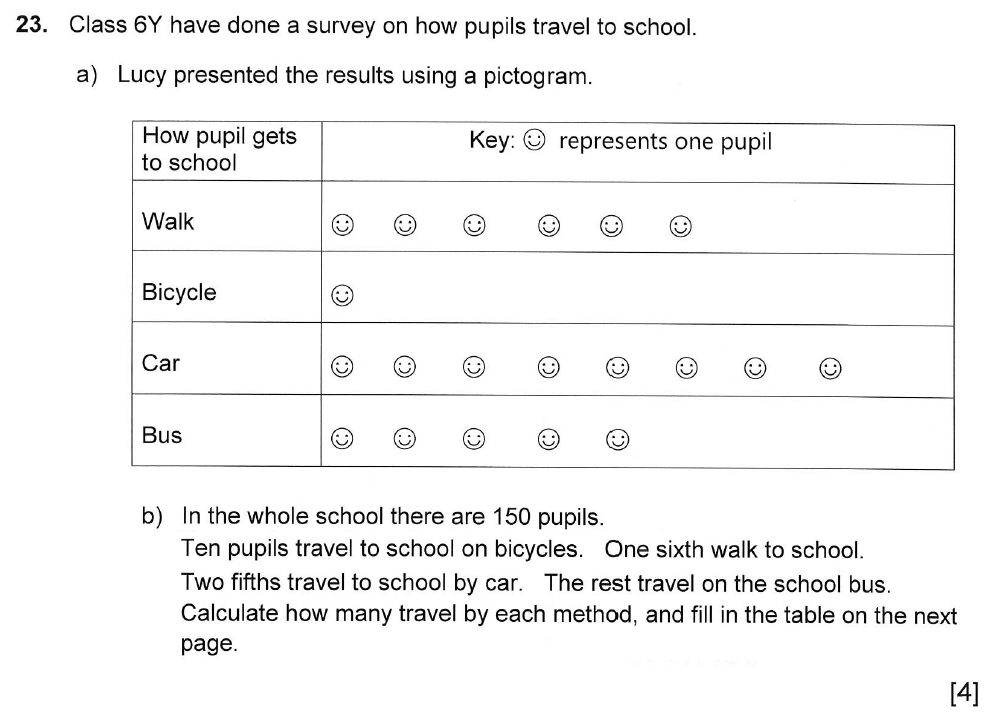
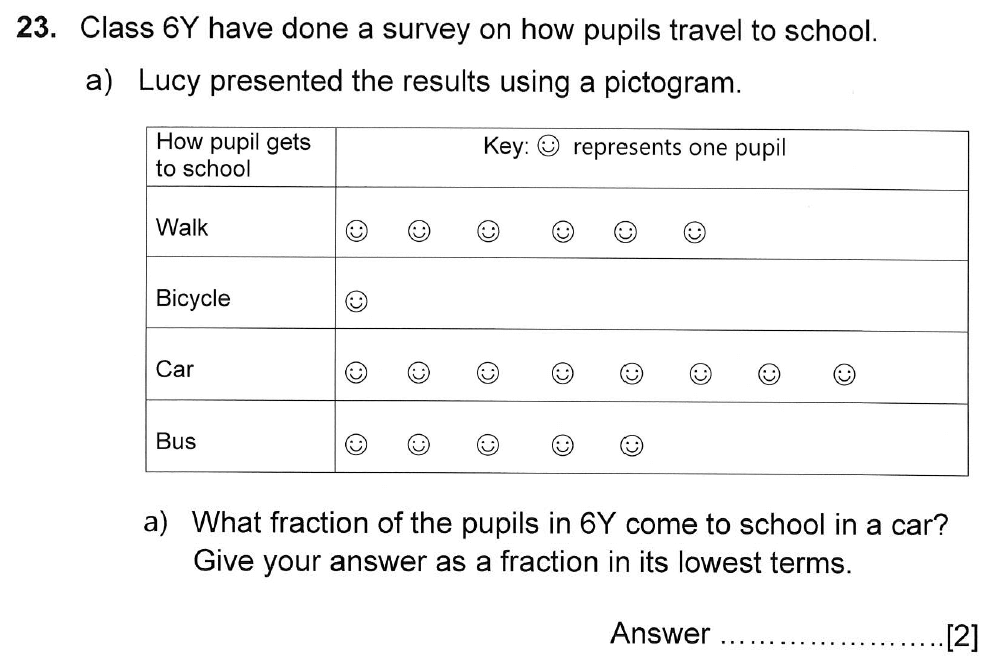
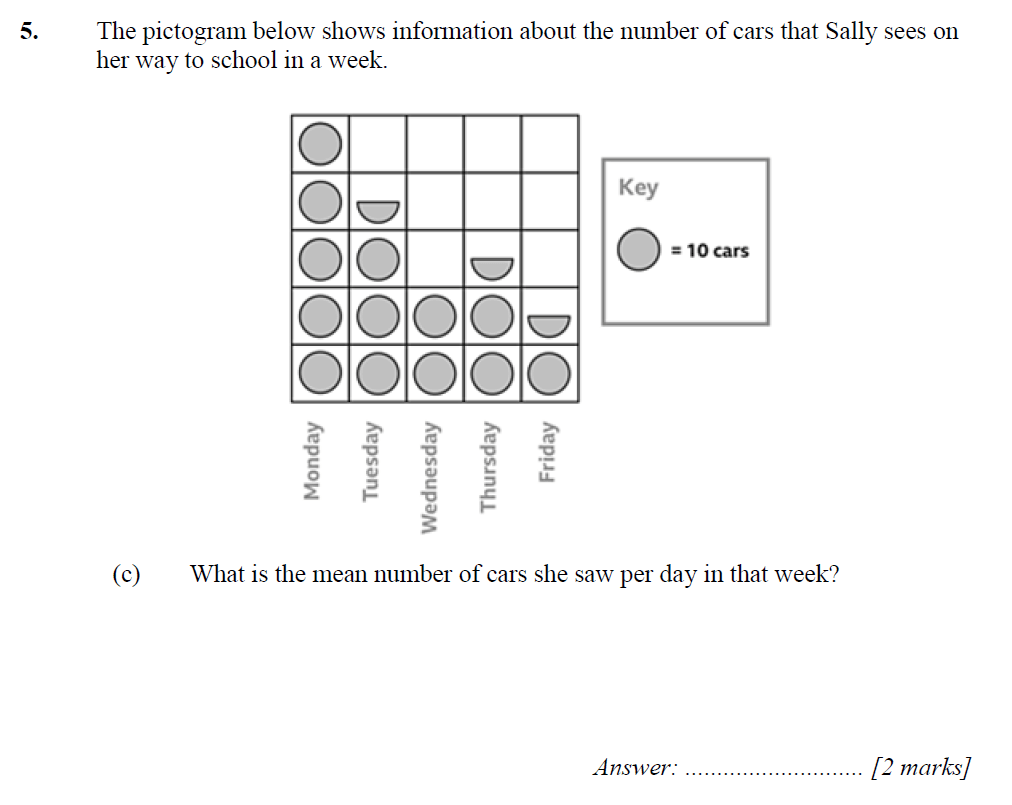
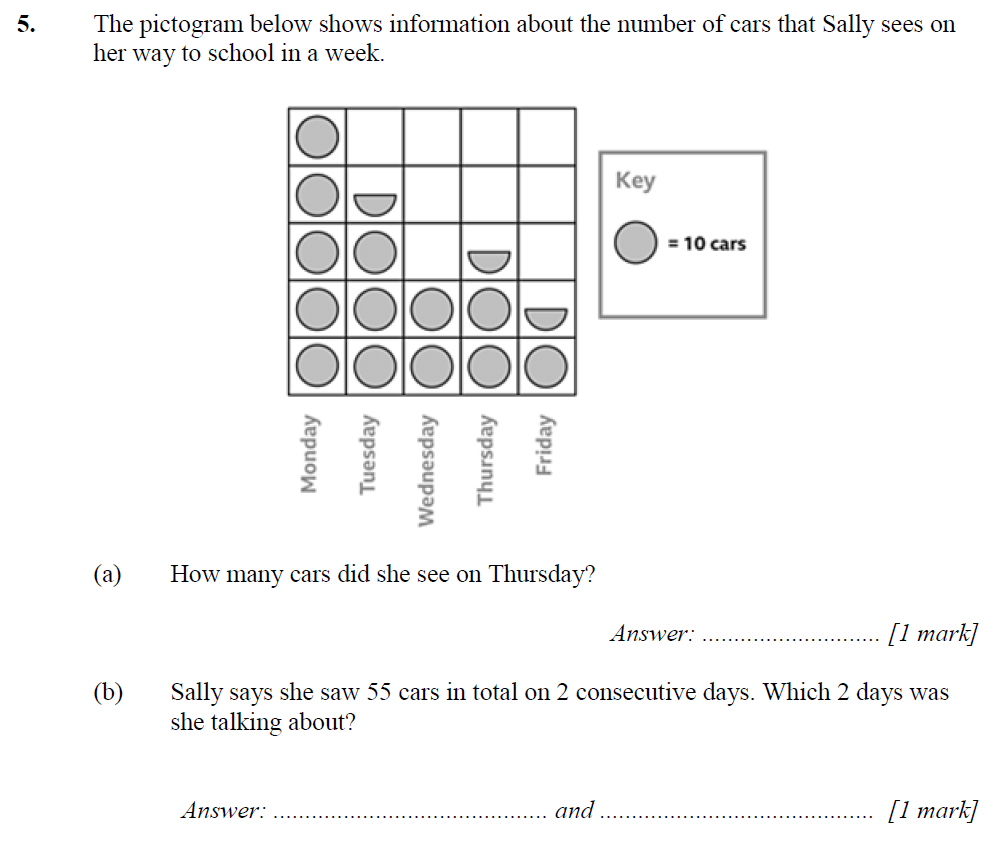
The pictogram below shows information about the favourite subjects of some students in a class.

Pictograms-11 + Toppicwise Article-image-01

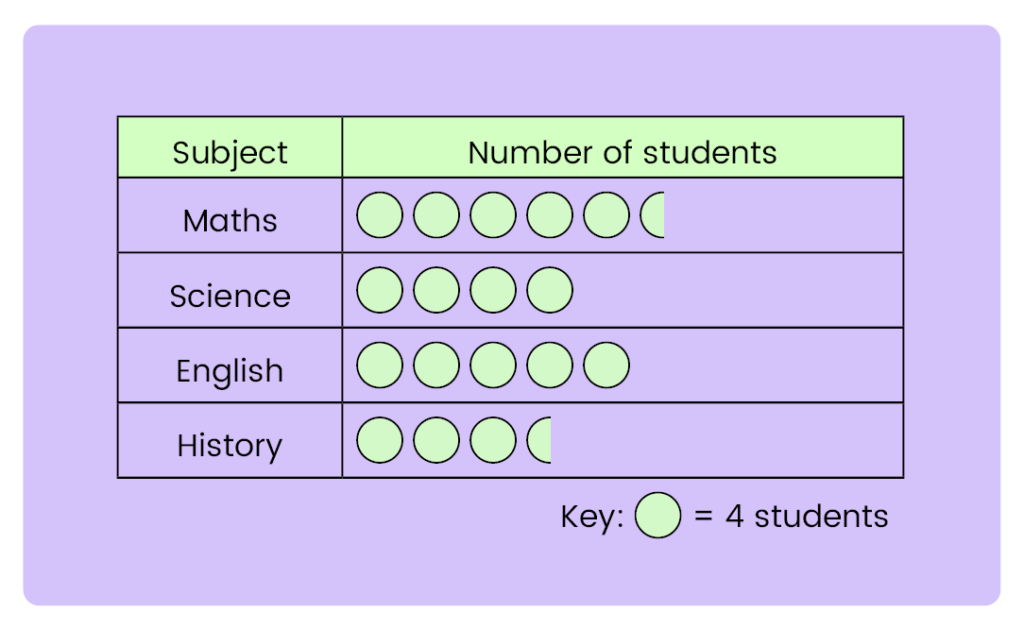
The first column in the above pictogram shows the list of subjects, while the second column shows the number of students who like the particular subject, using the circle symbol. According to the key in the pictogram, each circle represents four students. Which means the each half-circle in the pictogram represents 2 students.

1.1 How to Read and Interpret pictograms?

Steps:

  1. Select the required row/rows.
  2. To find the number of items in the selected row/rows, multiply the number of symbols in the row selected by the value of each symbol.
  3. Perform the required calculation.

Let us now use the above steps and interpret the pictograms using a few examples.

1.2 Solved Examples

Example 1: The pictogram below gives information about the types of ice creams sold in an ice cream parlour on a day.Pictograms-11 + Toppicwise Article-image-02

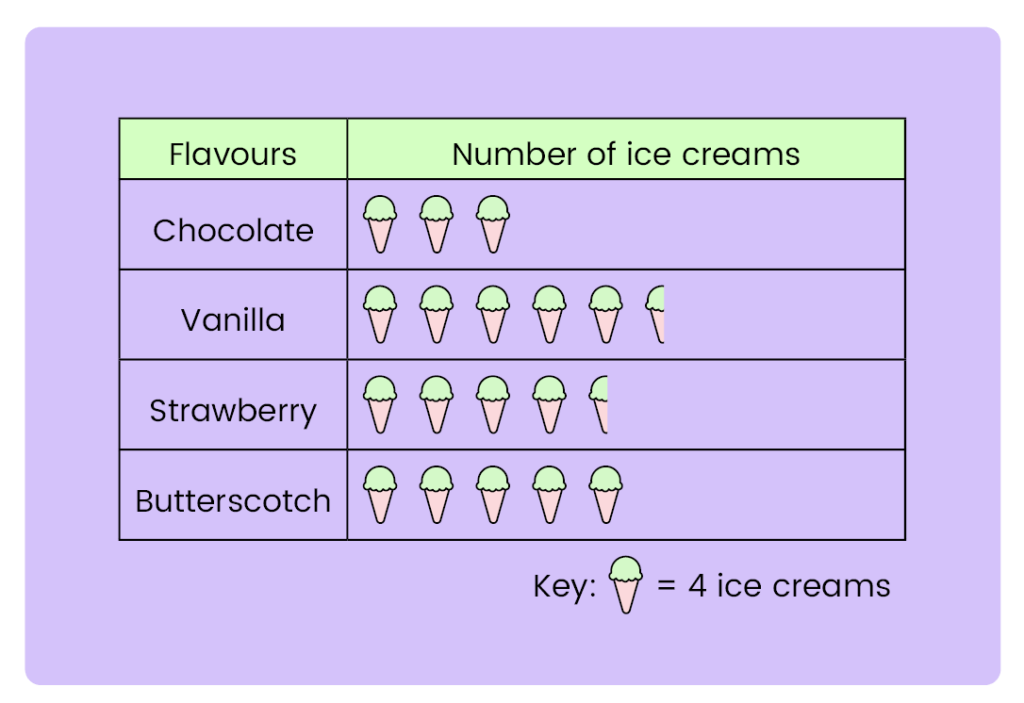
a) How many vanilla ice creams were sold?

b) How many more strawberry ice-creams were sold than chocolate ice-creams?

Solution:

a) Step 1: Selecting the row

Row: Vanilla

Step 2: Finding number of ice creams sold

Number of symbols in row vanilla = 5 1⁄2

Number of vanilla ice-creams sold = 5 1⁄2 × 4

= (5 × 4) + (1⁄2 × 4)

= 20 + 2

= 22

Hence, 22 vanilla ice-creams were sold.

b) Step 1: Selecting the rows:

Rows: Chocolate, Strawberry

Step 2: Finding number of ice-creams sold

Number of symbols in row chocolate = 3

Number of vanilla ice-creams sold = 3 × 4 = 12

Number of symbols in row strawberry =  4 1⁄2

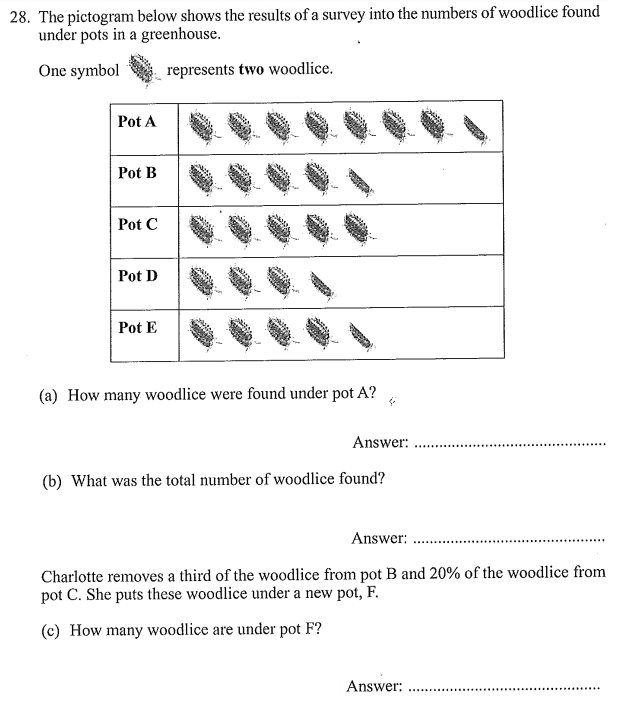
Number of vanilla ice-creams sold = 4 1⁄2 × 4

= (4 × 4) + (1⁄2 × 4)

= 16 + 2

= 18

Step 3: Perform the required calculation:

18 - 12 = 6

Hence, 6 more more strawberry ice-creams were sold than chocolate ice-creams.

Example 2: The pictogram below shows the number of people visiting the park in the early mornings on weekdays.

Pictograms-11 + Toppicwise Article-image-03

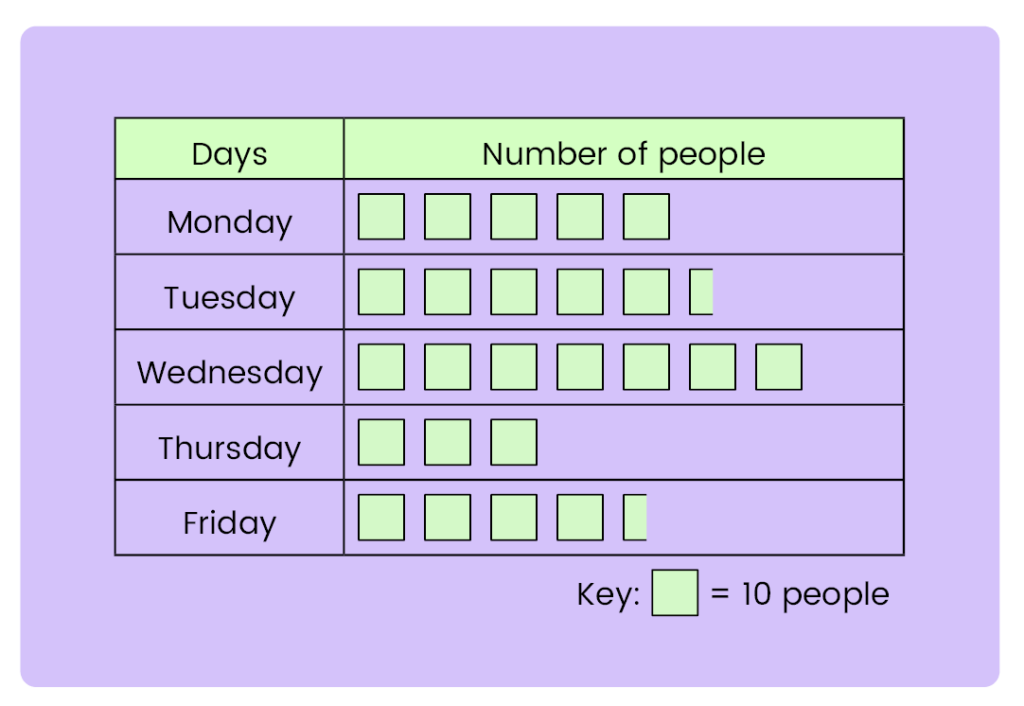
Work out the total number of people who visited the park on weekdays.

Solution:

Step 1: Selecting the rows:

Rows: Monday, Tuesday, Wednesday, Thursday, Friday

Step 2: Finding the number of people

Number of symbols in row Monday = 5

Number of people visiting the park on Monday = 5 × 10 = 50

Number of symbols in row Tuesday = 5 1⁄2

Number of people visiting the park on Tuesday  = 5 1⁄2 × 4 = (5 × 10) + (1⁄2 × 10)

= 50 + 5 = 55

Number of symbols in row Wednesday = 7

Number of people visiting the park on Wednesday = 7 × 10 = 70

Number of symbols in row Thursday = 3

Number of people visiting the park on Thursday = 3 × 10 = 30

Number of symbols in row Friday = 5 1⁄2

Number of people visiting the park on Friday  = 4 1⁄2 × 4 = (4 × 10) + (1⁄2 × 10)

= 40 + 5 = 45

Total number of people visited the park on weekdays = 50 + 55 + 70 + 30 + 45

= 250

Quiz Questions
Pictograms-11 + Toppicwise Article-Quiz Banner
11+ Maths Topicwise Worksheets Banks
11 Plus Maths Topic Wise Article
Get This Worksheet
Topicwise Artice Worksheet Form (#43)

Tally Marks & Pictographs

1. Tally Charts

Tally Charts are one of the different ways of collecting, recording, organizing and interpreting data. A tally chart is a simple way of recording data and counting the amount of something (frequency). Each occurrence is shown by a tally mark and every fifth tally is drawn diagonally. The tallies can then be counted to give the frequency. For example: 25 pupils were asked about their favourite type of movie.

11+ Topicwise Tally Charts and Pictograms Article image 1

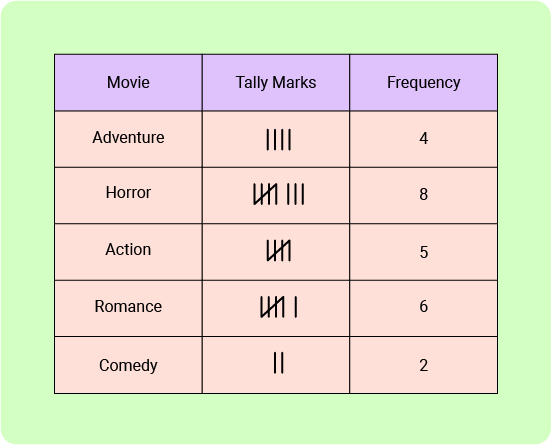
The advantage of using a tally chart is that it can be immediately clear which item(s) occurs the most/least frequently and can be helpful when analyzing data.  The tally makes it easy to see the most popular type of movie is horror and the least popular movie type is comedy.

Other graphs/charts (such as bar charts, pie charts and pictograms) can be produced from tally charts.

1.1. Example of Tally Charts

Example: 

Mac throws the die 30 times. He put these results:

3  4  1  6  3  4  5  1  4  4  5  6  3  1  4  1  5  1  6  3  1  5  4  1  6  3  5  6  1  4

Form a table and complete the tally chart and workout the frequency (how many times he got each number) 

11+ Topicwise Tally Charts and Pictograms Article image 2

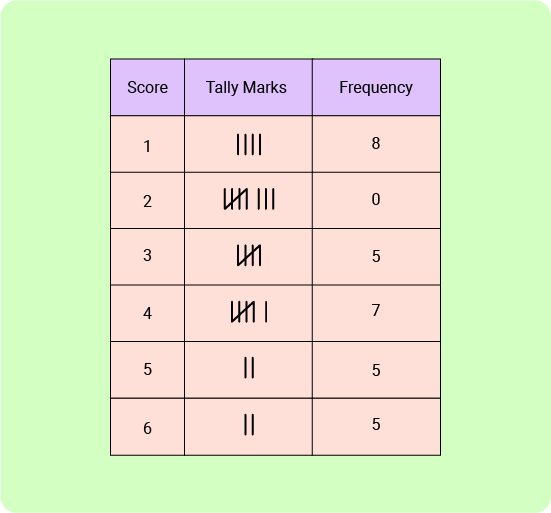
We see score one is repeated 8 times which is represented by 8 tally marks in an easy method. Similarly other scores. And the Frequency column adds up to 30.

Example:

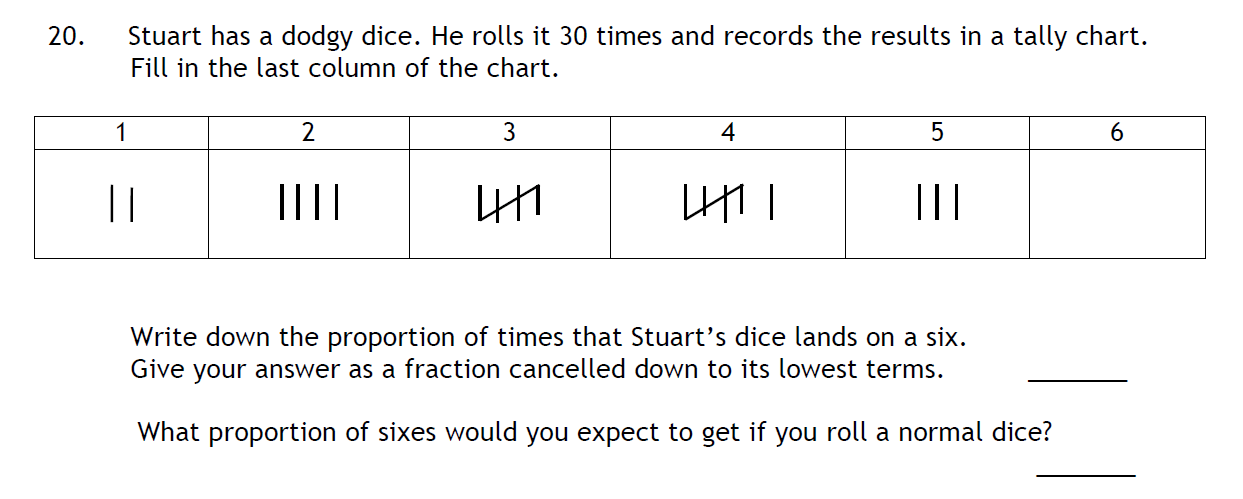
Jack has a dodgy dice. He rolls it 30 times and records the results in a tally chart. Fill in the last column of the chart.
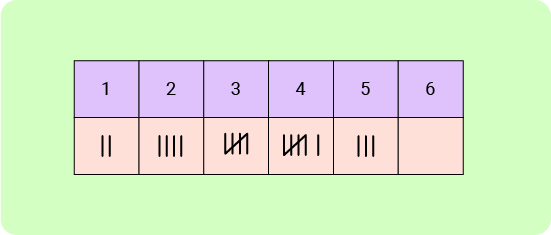
11+ Topicwise Tally Charts and Pictograms Article image 3

Solution:

The frequency table shows 2 + 4 + 5 + 6 + 3 + x = 30

 Number of times the dice lands on x = 30 - (2 + 4 + 5 + 6 + 3)

                                                            = 30-20

                                                            = 10

11+ Topicwise Tally Charts and Pictograms Article image 4

2. Pictogram

A pictogram is a chart that uses pictures or symbols to represent data. To read pictograms carefully one should understand what the symbols mean. Each picture in the pictogram represents a physical object.

All pictograms should have a key. A key shows you what each symbol represents. A pictograph design can be constructed using a table with two columns. In the first column is the name of the group, and the second column features the pictures.

For example: Below is a pictogram showing the number of doughnuts eaten by four friends in the past month.

11+ Topicwise Tally Charts and Pictograms Article image 5

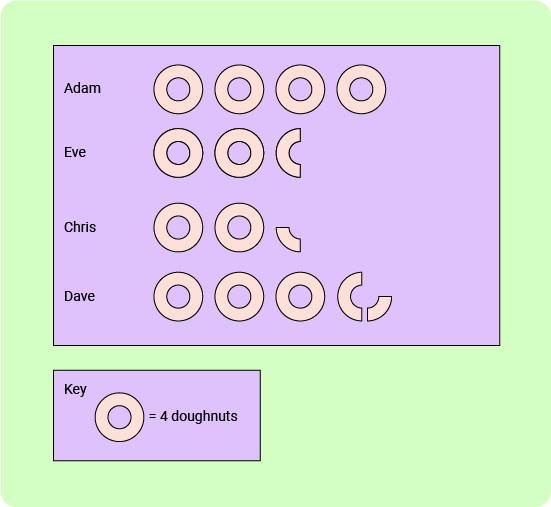
Here, each picture represents 4 doughnuts and so we can see that Adam ate 16 doughnuts, Eve ate 10 doughnuts, Chris ate 9 doughnuts, etc.

Hence Number of doughnuts ate by Adam = 4 × 4 = 16

2.1 Examples on Pictogram:

Example: 

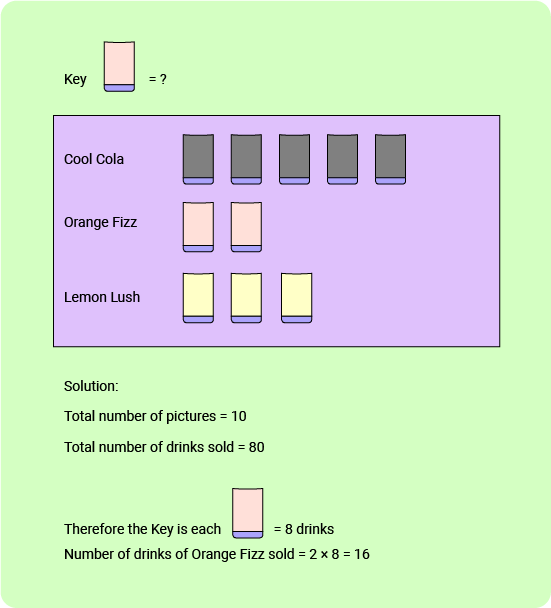
Mac drew a pictogram to show information about the drinks sold from a vending machine in the afternoon

Mac knew that 80 drinks were sold in total that afternoon.

How many drinks of Orange Fizz were sold that afternoon?.

The key for the pictogram is incomplete.

11+ Topicwise Tally Charts and Pictograms Article image 6

Quiz Questions
11+ Topicwise Tally Charts and Pictograms Article Quiz Banner
11+ Maths Topicwise Worksheets Banks
11 Plus Maths Topic Wise Article
Get This Worksheet
Topicwise Artice Worksheet Form (#43)

11+ Maths Topics

  • Average (2)
  • Other (8)
  • Geometry (1,273)
  • Magic square (27)
  • Scale Drawings (37)
  • Logical Word Problems (8)
  • Composite Shapes (1)
  • Measurement (364)
  • Time (312)
  • Sorting Tree (3)
  • Number Patterns and Sequences (346)
  • Temperature (61)
  • Data Collection and Presentation (19)
  • Networks (12)
  • Shortest time (1)
  • Numbers (3,973)
  • Clock (3)
  • Recipes and Proportions (23)
  • Speed Distance Time (112)
  • Profit and loss (5)
  • Alphabet codes (10)
  • Money (420)
  • Logical Problems (746)
  • Time table (14)
  • Age Problems (44)
  • Permutation and Combinations (102)
  • Probability (109)
  • Patterns and Sequences (125)
  • Scale reading (42)
  • Train Timetables (33)
  • Algebra (1,114)
  • Statistics (542)
  • Ratio and Proportion (187)
  • Currency Conversions (75)
  • Frequently Asked Questions
    What is a good score in 11+ Maths ?

    What counts as a "good" score will vary depending on the school you want to attend. The standardized 11 Plus test score average across the country is roughly 100. The highest average in some areas is 111. The lowest scores would often fall between 60 and 70, while the highest scores would normally fall between 130 and 140. To achieve excellent marks on 11+ Maths Exams, practice 11+ Maths topic-wise questions.

    How to prepare for the 11+ Maths exam?

    The best way to prepare for the 11+ Maths Exam is by practicing 11+ Maths topic-wise questions regularly.

    Can I cancel my subscription?

    Maths online subscriptions are “Non-Refundable“. No refunds can be issued for any reason. This is because of the nature of digital products.

    You should, therefore, make sure that the Maths online subscriptions fulfil your needs before you subscribe.

    As these are digital products, we advise parents to go through our Free Past Papers provided on our website and once decided they can buy subscriptions.

    Maths:
    11+ Sample Paper with answers - 1

    11+ Sample Paper with answers - 2

    What kind of questions are asked in the 11 Plus Maths exam?

    The majority of the 11 Plus Maths questions are mathematical problem-solving, where pupils need to understand and apply mathematical concepts. With regular practice of 11+ Maths Topic-wise questions, you will pass the 11-plus Maths Exam with a high score.

    What do you need to know for the 11 Plus Maths exam?

    The children must master the following topics for the 11 plus exams

    • Number and place value.
    • Addition, subtraction, multiplication, and division.
    • Fractions, percentages, decimals.
    • Ratio and proportion.
    • Algebra.
    • Measurement.
    • Geometry (properties and position of shapes, coordinates)
    • Statistics.

    Get 10,000+ Topic-wise questions by subscribing to our 11+ Maths Topic-wise questions. These questions are collected from 180+ Maths past papers.

    What is subscription term ?

    11 Plus Maths Past Papers Subscription

    Any PiAcademy Memberships are for 1 year (366 days), We give Instant unlock to all exam Resources So that you can plan your 11+ Preparation according to your convenience and as per our Planner Spreadsheets.

    Check All Courses >>

    © 2014 - 2025 PiAcademy Limited, All Rights Reserved

    calendar-fullcrossmenu linkedin facebook pinterest youtube rss twitter instagram facebook-blank rss-blank linkedin-blank pinterest youtube twitter instagram